Fig. 2
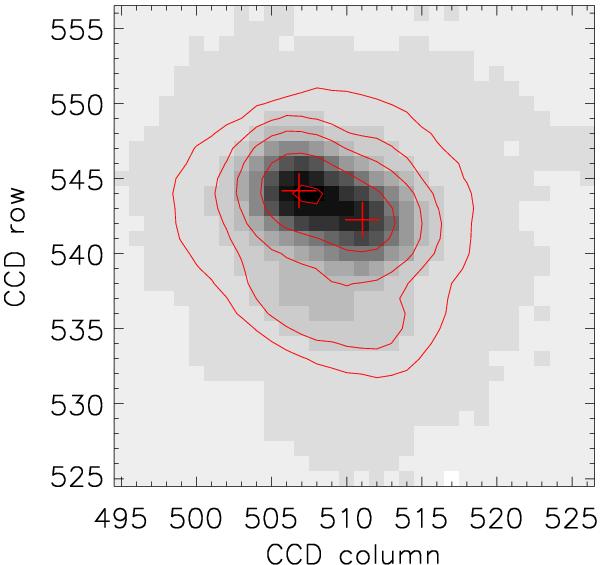
Two components of AB Dor near apastron on 1 January 2009, observed with VLT/NACO. North is up, east is left; the scale is 0.13 arcsec/pix. The contours indicate 95, 50, 20, 10, and 5% of the maximum flux. The crosses indicate the positions of the two components as determined by our 2D Gaussian model. The downward blob, most pronounced in the 10%–contour, is due to a pronouncedly asymmetric wing of the PSF of this image.
Current usage metrics show cumulative count of Article Views (full-text article views including HTML views, PDF and ePub downloads, according to the available data) and Abstracts Views on Vision4Press platform.
Data correspond to usage on the plateform after 2015. The current usage metrics is available 48-96 hours after online publication and is updated daily on week days.
Initial download of the metrics may take a while.