Free Access
Fig. 3
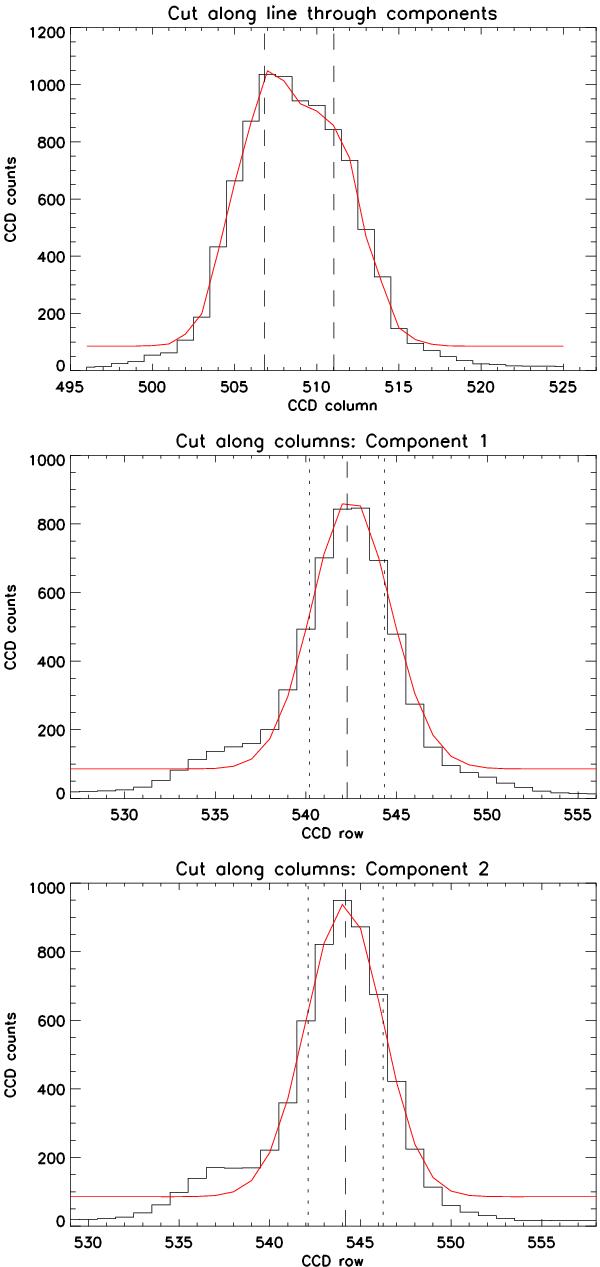
Cuts through the image shown in Fig. 2. The vertical cuts of the two lower panels clearly show the asymmetric PSF wing; they also illustrate that our Gaussian PSF model, shown as the continuous graphs, reliably fits the PSF core in spite of this asymmetry.
Current usage metrics show cumulative count of Article Views (full-text article views including HTML views, PDF and ePub downloads, according to the available data) and Abstracts Views on Vision4Press platform.
Data correspond to usage on the plateform after 2015. The current usage metrics is available 48-96 hours after online publication and is updated daily on week days.
Initial download of the metrics may take a while.