Fig. 5
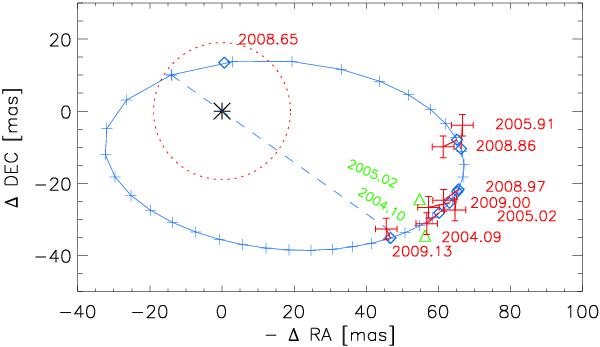
Orbit of AB Dor B projected on the sky as determined by our MCMC model (north up, east left). Red error bars represent positions measured in the NACO images, each linked to a blue diamond that indicates the corresponding position of our orbit model. The standard deviation of the measured distances between the two components is about 3.0 mas. The upper limit for the distance at 2008.65 is indicated by the dashed circle, also determined with an uncertainty of about 3.0 mas. Plus symbols mark approximately 10-day intervals on the orbit, and the dashed line connects its periastron and apastron. The two previously published positions are indicated by green triangles; they were not used for our model. See Sect. 3.2 for details.
Current usage metrics show cumulative count of Article Views (full-text article views including HTML views, PDF and ePub downloads, according to the available data) and Abstracts Views on Vision4Press platform.
Data correspond to usage on the plateform after 2015. The current usage metrics is available 48-96 hours after online publication and is updated daily on week days.
Initial download of the metrics may take a while.