Free Access
Fig. 11
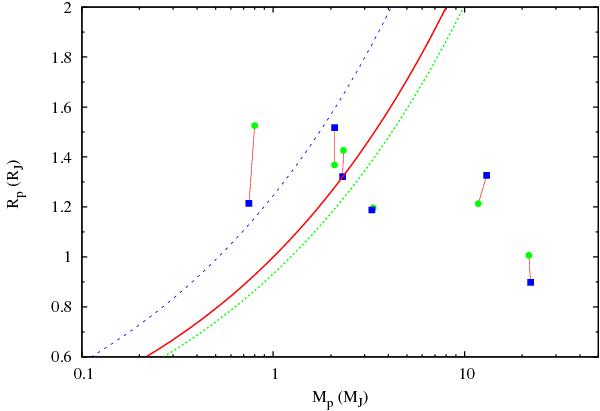
Blue squares represent planetary mass and radius derived in this work in comparison with literature values (green circles). Characteristic isodensity curves are plotted for Saturn (dashed), Jupiter (solid), and Neptune (dotted).
Current usage metrics show cumulative count of Article Views (full-text article views including HTML views, PDF and ePub downloads, according to the available data) and Abstracts Views on Vision4Press platform.
Data correspond to usage on the plateform after 2015. The current usage metrics is available 48-96 hours after online publication and is updated daily on week days.
Initial download of the metrics may take a while.