Fig. 8
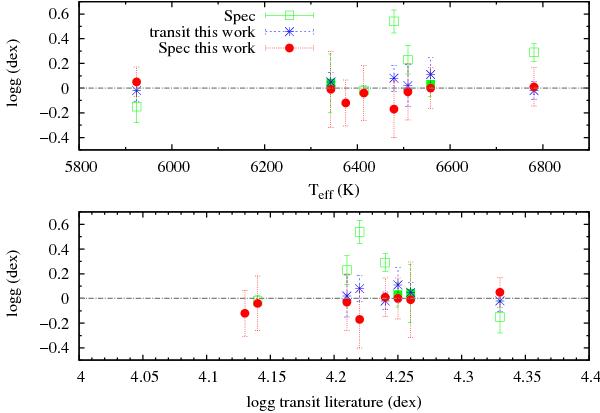
Differences in surface gravity derived from a transit light curve analysis minus other methods from Table 7. Circles correspond to the comparison of log g derived in this work. Squares correspond to the methodology applied by Valenti & Fischer (2005) and filled squares to other spectral synthesis methods. Asterisks show the comparison between log g derived from the light curve analysis of the literature and of this work.
Current usage metrics show cumulative count of Article Views (full-text article views including HTML views, PDF and ePub downloads, according to the available data) and Abstracts Views on Vision4Press platform.
Data correspond to usage on the plateform after 2015. The current usage metrics is available 48-96 hours after online publication and is updated daily on week days.
Initial download of the metrics may take a while.