Fig. 30
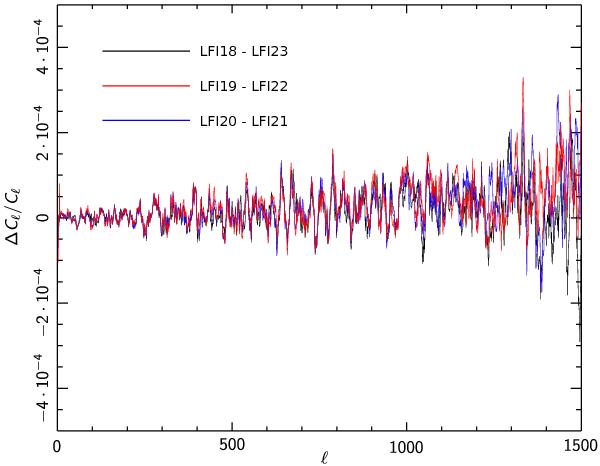
Relative difference between the spectra of the maps simulated with one and two instrument databases. The three curves represent power spectra relative to three different feed horn pairs in the 70 GHz frequency channel. A running average smoothing kernel has been applied to reduce the scatter and enhance any larger-scale trends. The relative uncertainties are of the order of ΔCℓ/Cℓ ≲ 10-4.
Current usage metrics show cumulative count of Article Views (full-text article views including HTML views, PDF and ePub downloads, according to the available data) and Abstracts Views on Vision4Press platform.
Data correspond to usage on the plateform after 2015. The current usage metrics is available 48-96 hours after online publication and is updated daily on week days.
Initial download of the metrics may take a while.