Fig. 10
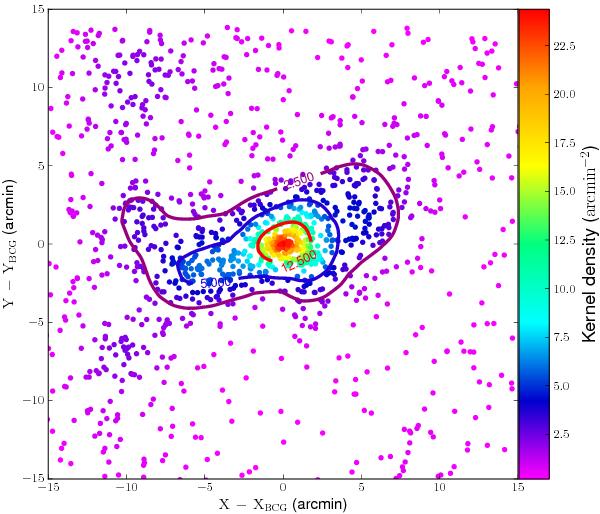
Spatial distribution of cluster members. The local number density is color coded as indicated by the bar at the right side of the plot. Coordinates are in arcmin with respect to the position of the BCG, see Table 1. Galaxies belonging to Regions (a), (b), (c), which are defined in Sect. 3.2.2, are those inside the red, blue, and purple solid lines, respectively. Galaxies belonging to Region (d) are the outer points.
Current usage metrics show cumulative count of Article Views (full-text article views including HTML views, PDF and ePub downloads, according to the available data) and Abstracts Views on Vision4Press platform.
Data correspond to usage on the plateform after 2015. The current usage metrics is available 48-96 hours after online publication and is updated daily on week days.
Initial download of the metrics may take a while.