Fig. 2
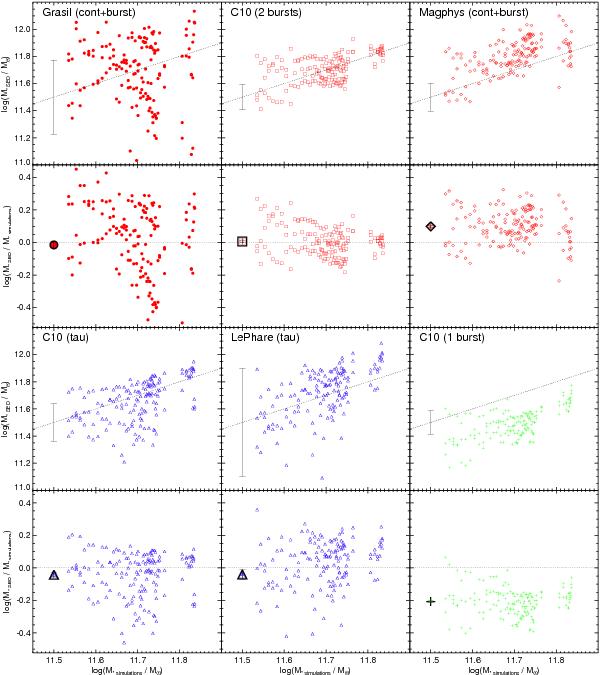
Comparison of the stellar masses derived from the SED modelling and the true stellar masses in the simulation (upper rows for each model) and the ratio of these masses as a function of true stellar mass in the simulation (lower rows). Dotted lines indicate agreement between these masses. On each upper panels the error bar reflects the typical uncertainty in the stellar mass measurement. Large symbols with error bars at log (M∗ simulations/M⊙) = 11.5 correspond to the mean ratios for each method. Models are colour-coded according to the assumed SFH: double (red), exponentially declining (tau, blue), and single-burst (green). Except when a single-burst SFH is used, the SED modelling codes accurately recover the true stellar masses of the simulated galaxies, albeit with a factor of ~2 scatter. When a single-burst SFH is assumed, the stellar masses are systematically underestimated by 0.2 dex.
Current usage metrics show cumulative count of Article Views (full-text article views including HTML views, PDF and ePub downloads, according to the available data) and Abstracts Views on Vision4Press platform.
Data correspond to usage on the plateform after 2015. The current usage metrics is available 48-96 hours after online publication and is updated daily on week days.
Initial download of the metrics may take a while.