Fig. 7
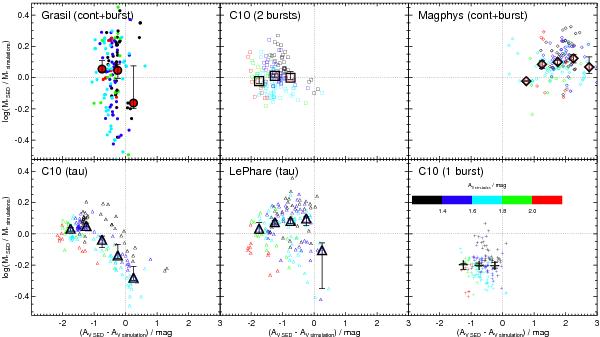
Ratio of the stellar masses derived from the SED modelling and the true stellar masses in the simulation as a function of the difference between the optical V-band dust attenuation recovered in the SED modelling and in the simulation. Dotted lines indicate agreement between these masses and attenuations. Large symbols with error bars represent the medians in the AV difference bins. All points are colour-coded by the dust attenuation in the simulations (colour bar). These plots indicate that for all models except the C10 (tau) model, discrepancies between the true and recovered AV values are not the primary cause of inaccurate stellar mass recovery.
Current usage metrics show cumulative count of Article Views (full-text article views including HTML views, PDF and ePub downloads, according to the available data) and Abstracts Views on Vision4Press platform.
Data correspond to usage on the plateform after 2015. The current usage metrics is available 48-96 hours after online publication and is updated daily on week days.
Initial download of the metrics may take a while.