Fig. 1
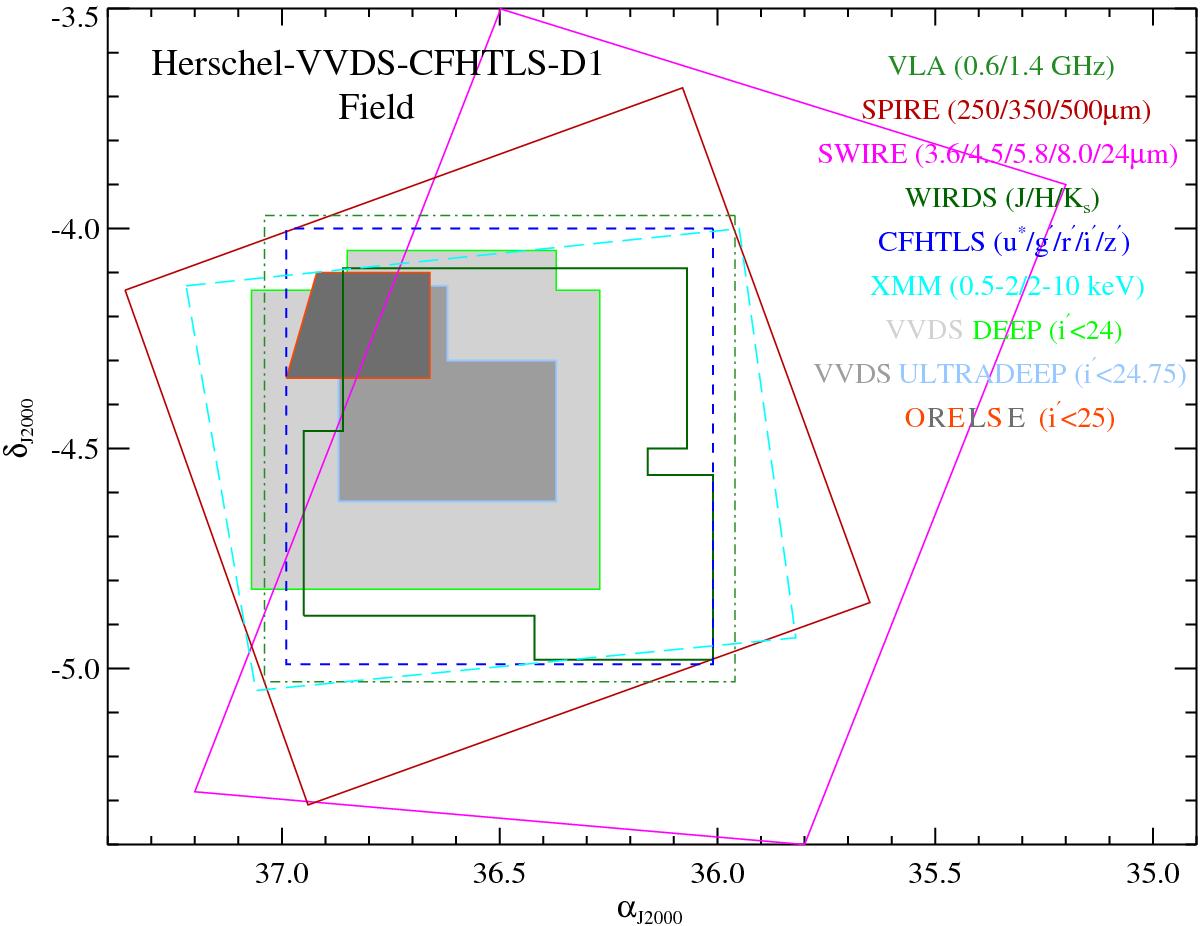
Overview of the sky coverage of the observations available on the CFHTLS-D1 field. More details on each observation are given in Table 1. Imaging data is represented by open regions bounded by the various lines. Spectroscopic observations are represented by shaded regions. The overlap region that is used to select our final Herschel sample is defined by the intersection of the CFHTLS optical imaging (dashed blue line), SWIRE NIR/MIR imaging (solid magenta line), and the Herschel far-infrared imaging (solid dark red line). In many cases throughout the paper the sample is further restricted to those galaxies that are covered by WIRDS NIR imaging (solid dark green line). The full extent of the SWIRE coverage is truncated here for clarity, though the coverage over the overlap region is accurately represented.
Current usage metrics show cumulative count of Article Views (full-text article views including HTML views, PDF and ePub downloads, according to the available data) and Abstracts Views on Vision4Press platform.
Data correspond to usage on the plateform after 2015. The current usage metrics is available 48-96 hours after online publication and is updated daily on week days.
Initial download of the metrics may take a while.