Fig. 13
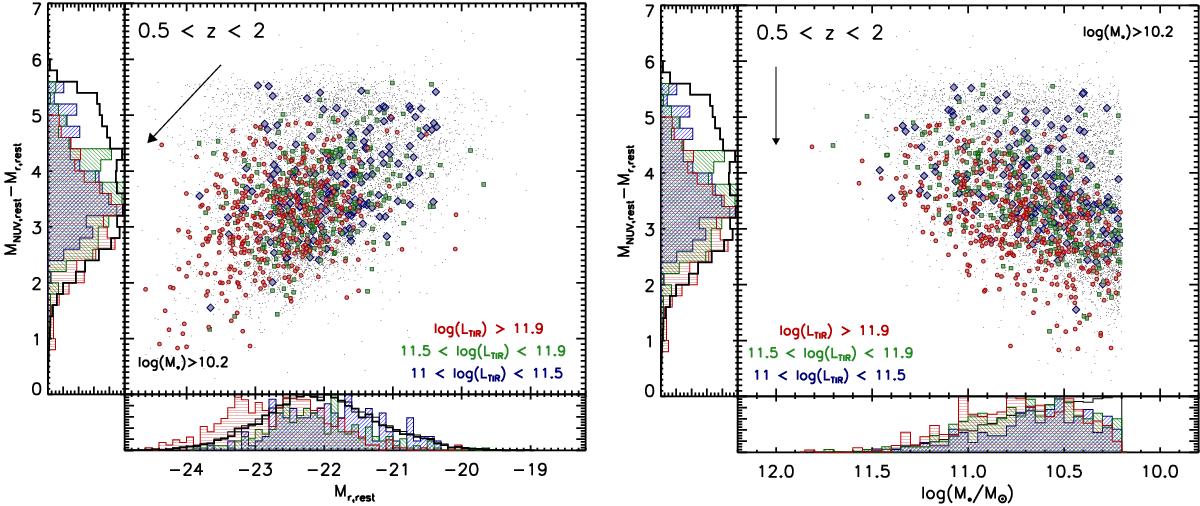
Similar to Fig. 7 except that only a single redshift range is plotted (0.5 <z< 2), a redshift range which comprises the bulk of our sample. SPIRE-detected galaxies are broken into high-LTIR (red filled circles), moderate-LTIR (green filled squares), and low-LTIR (blue filled diamonds) subsamples. Again in both the CMD (left) and CSMD (right), galaxies which went undetected or were not detected at high enough significance in the SPIRE imaging are shown as small black points. Histograms are normalized in the same way as Fig. 7 and arrows again represent the movement in each phase space when an stellar continuum extinction of Es(B − V) = 0.3 is applied. Only those galaxies with Ks< 24.0 and stellar masses larger than the completeness limit (log (ℳ∗) > 10.2) are plotted. While the LIRG subsamples show a high level of similarity in their MNUV − Mr colors and Mr absolute magnitudes (left), the ULIRG population appears both bluer and brighter optically. The range of stellar masses spanned by the ULIRGs at any given color is generally larger than that of the LIRG samples (right) suggesting that the ULIRG population is inhomogenous, comprised of nascent galaxies undergoing their initial starbursts and older galaxies undergoing intense rejuvinated starburst events.

Current usage metrics show cumulative count of Article Views (full-text article views including HTML views, PDF and ePub downloads, according to the available data) and Abstracts Views on Vision4Press platform.
Data correspond to usage on the plateform after 2015. The current usage metrics is available 48-96 hours after online publication and is updated daily on week days.
Initial download of the metrics may take a while.