Fig. 14
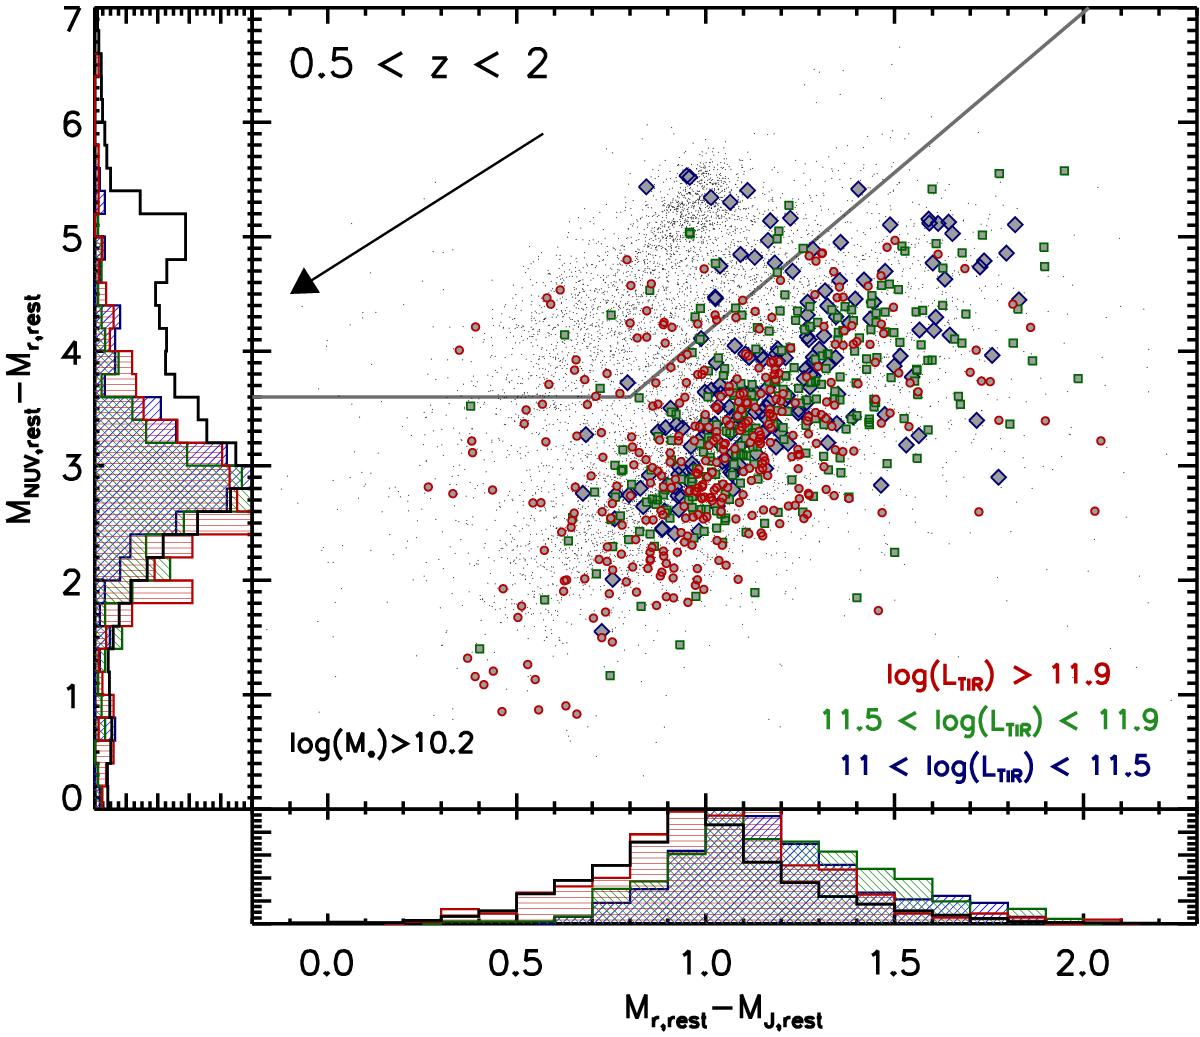
Similar to Fig. 8 but plotting only those galaxies in the redshift range 0.5 <z< 2 broken into LTIR subsamples. The symbols are identical to those of Fig. 13. Again only those galaxies brighter than Ks< 24.0 and with stellar masses log (ℳ∗) > 10.2 are plotted. Histograms are normalized and defined in the same way as Fig. 8 (i.e., effective colors) and arrows again represent the effect of applying Es(B − V) = 0.3. The fraction of galaxies in the quiescent region (above the line) of the diagram is roughly the same (~5–8%) for all LTIR subsamples. However, the ULIRG galaxies in the quiescent region can easily be moved to the lower left part of the diagram by applying the average extinction found in Sect. 4.4.1. On the contrary, the presence of LIRGs in the quiescent part of the diagram cannot be explained by extinction effects alone which hints that the optical colors of these galaxies is dominated by light from older stellar populations.
Current usage metrics show cumulative count of Article Views (full-text article views including HTML views, PDF and ePub downloads, according to the available data) and Abstracts Views on Vision4Press platform.
Data correspond to usage on the plateform after 2015. The current usage metrics is available 48-96 hours after online publication and is updated daily on week days.
Initial download of the metrics may take a while.