Fig. 2
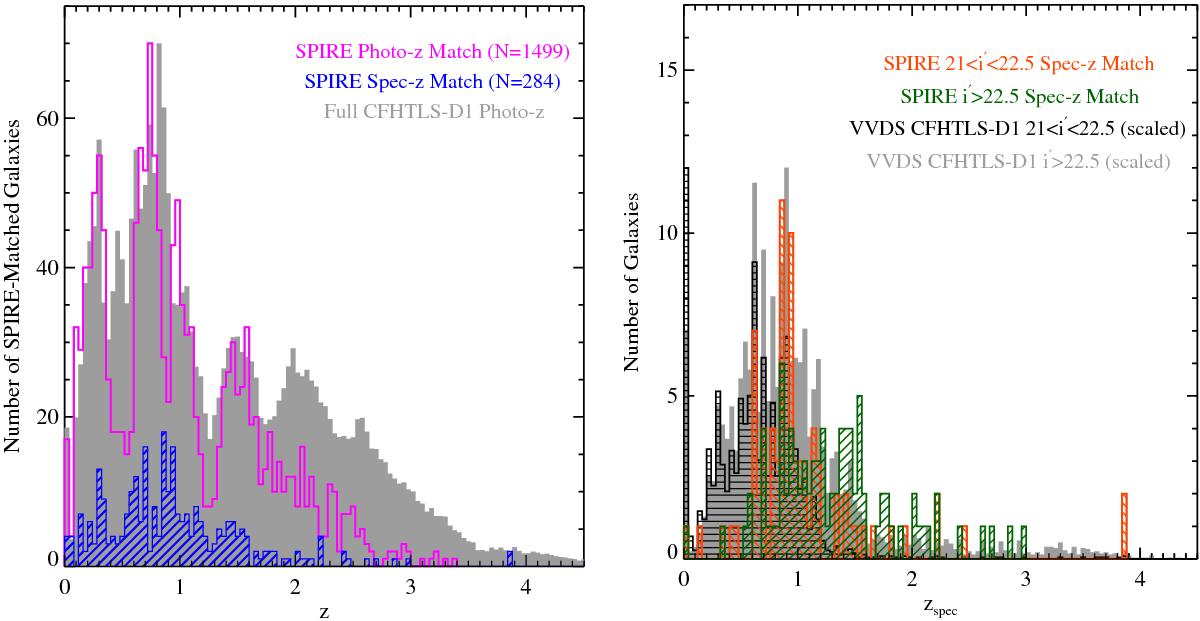
Left: photometric (open magenta histogram) and spectroscopic (dashed blue histogram) redshift distribution of the 1783 Herschel/ SPIRE-matched sources in our sample. Only those objects which have reliable redshifts (see text) and are detected at ≥3σ in at least one of the three SPIRE bands are plotted. The various peaks in the photometric redshift distribution are not real but are rather an artifact of the method used to calculate the photometric redshifts as can be seen in the photometric redshift distribution of the full CFHTLS-D1 sample (i′< 25.5) plotted as the gray filled histogram. Right: spectroscopic redshift histogram of two samples of SPIRE-detected galaxies at different optical brightness (orange and green hashed histograms). Also plotted is the spectroscopic redshift distribution of the full VVDS sample in this field for the same optical magnitude bins (black hashed and gray filled histograms). Despite median magnitudes that differ by ~1.5 in the i′ band, the redshift distributions of the two SPIRE-detected samples appear largely similar, with an excess of galaxies at higher redshift in the (optically) fainter sample that is dwarfed by the excess observed in the full optical sample.

Current usage metrics show cumulative count of Article Views (full-text article views including HTML views, PDF and ePub downloads, according to the available data) and Abstracts Views on Vision4Press platform.
Data correspond to usage on the plateform after 2015. The current usage metrics is available 48-96 hours after online publication and is updated daily on week days.
Initial download of the metrics may take a while.