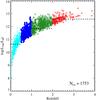
Fig. 3
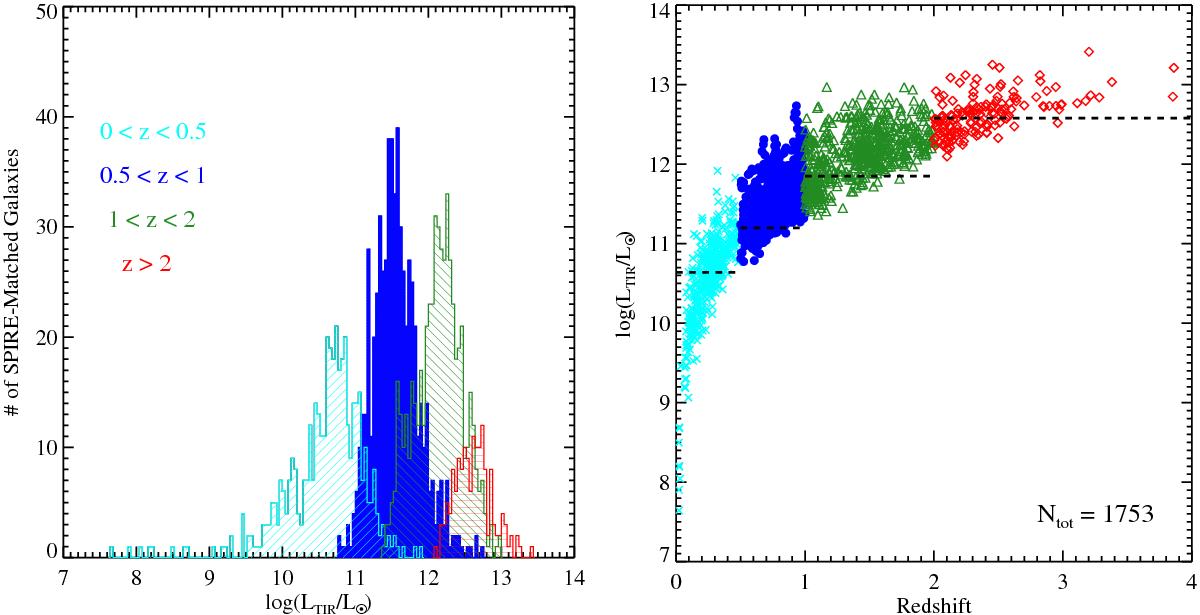
Left: full total infrared (TIR) luminosity distribution for the 1753 galaxies in the final Herschel sample. Galaxies are binned as a function of (photometric or spectroscopic) redshift using the nominal redshift bins that are used thoughout most of the analysis in this study. Though the dynamic range of SPIRE observations is small, the large redshift baseline of this study allows us to study galaxies that span a factor of 10 000 in TIR luminosity. Right: similar to the left panel except the dynamic range of the Herschel sample is shown at each redshift. Herschel-detected galaxies are color coded in an identical manner to that of the left panel: galaxies with 0 <z< 0.5 are represented by cyan Xs, galaxies with 0.5 <z< 1 are represented by filled blue circles, galaxies with 1 <z< 2 are represented by dark green open triangles, and galaxies with 2 <z< 4 are represented by open red diamonds. The TIR limits used to contruct a volume-limited sample for each redshift bin are denoted by the dashed horizontal lines.
Current usage metrics show cumulative count of Article Views (full-text article views including HTML views, PDF and ePub downloads, according to the available data) and Abstracts Views on Vision4Press platform.
Data correspond to usage on the plateform after 2015. The current usage metrics is available 48-96 hours after online publication and is updated daily on week days.
Initial download of the metrics may take a while.