Fig. 4
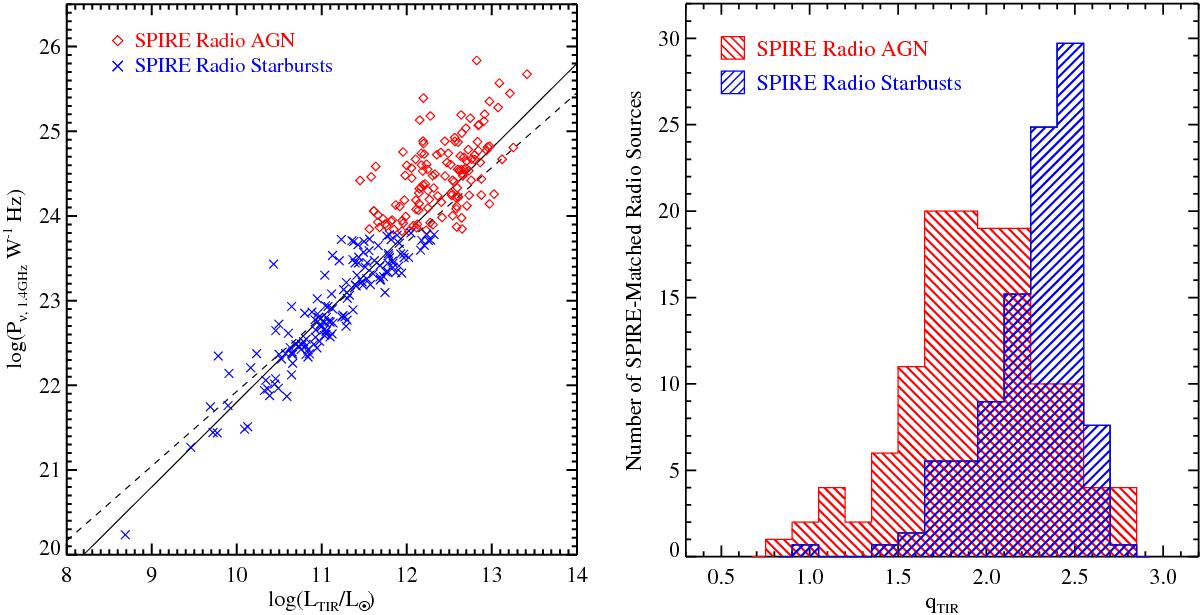
Left: total infrared (TIR) luminosity plotted against the rest-frame power density at 1.4 GHz of all galaxies with reliable redshifts detected significantly in both the VLA and Herschel imaging. Galaxies which we have defined as hosting radio AGN are represented by open red diamonds and galaxies whose radio emission likely originates either solely from star-forming processes or some combination of star formation and AGN activity are shown as blue Xs. The dashed line denotes our formal best fit relation for SPIRE radio starbursts. The solid line is the best-fit relation from Del Moro et al. (2013) for “radio normal” galaxies. Right: histogram of qTIR for the SPIRE radio AGN and SPIRE radio starburst samples. The two histograms are normalized to each other. Though there is significant overlap between the two samples, in large part due to SPIRE radio starbursts that likely host lower luminosity AGN, the two distributions are inconsistent with being drawn from the same parent sample.
Current usage metrics show cumulative count of Article Views (full-text article views including HTML views, PDF and ePub downloads, according to the available data) and Abstracts Views on Vision4Press platform.
Data correspond to usage on the plateform after 2015. The current usage metrics is available 48-96 hours after online publication and is updated daily on week days.
Initial download of the metrics may take a while.