Fig. 5
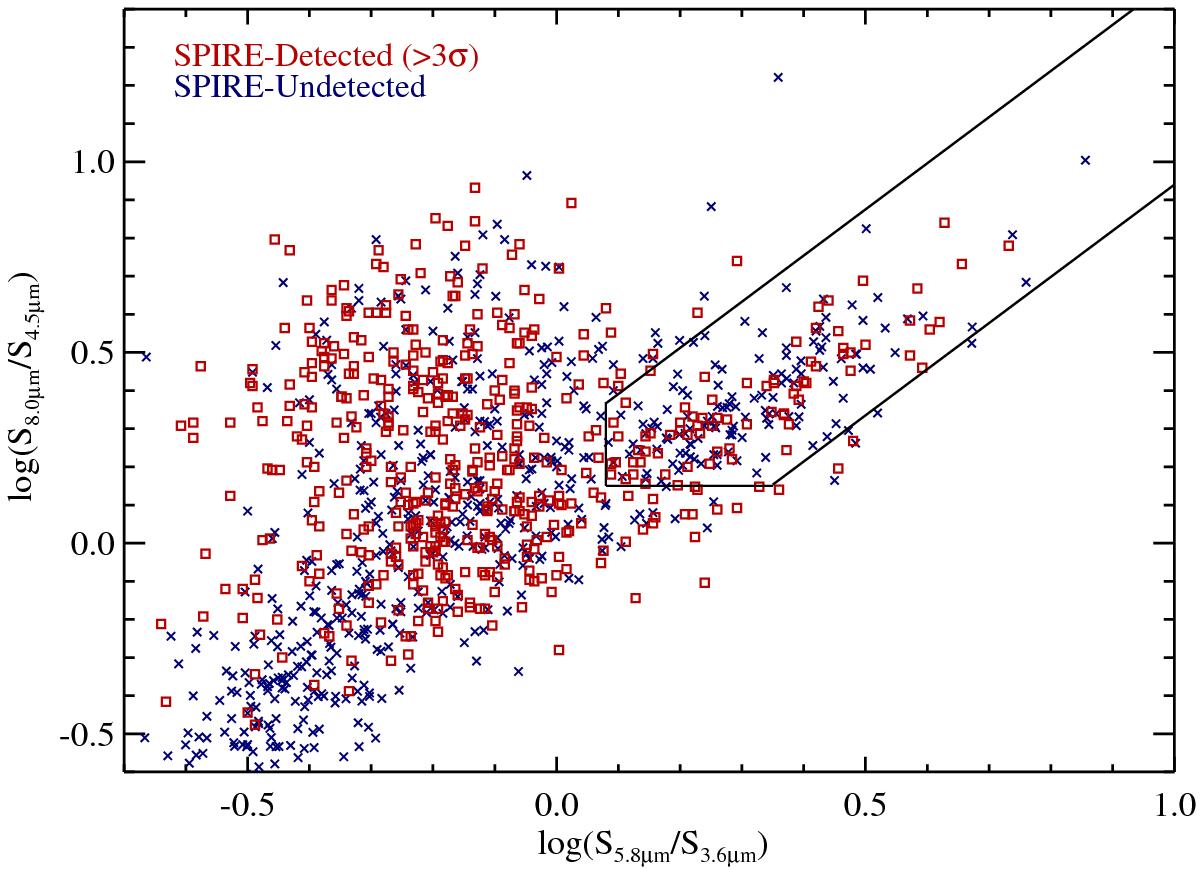
Spitzer/IRAC NIR color-color diagram for all galaxies in the overlap region (see Sect. 2.1) with >5σ detections in all four IRAC bands. Both galaxies which are undetected in Herschel/SPIRE and galaxies which are marginally detected in Herschel/SPIRE (<3σ) are plotted as blue Xs. Galaxies detected at ≥3σ in at least one of the three SPIRE bands are shown as open red squares. The solid black lines are adopted from Donley et al. (2012) and denote the region used to select IR-AGN. While a large fraction of galaxies with detections in all four IRAC bands are also detected in Herschel (because of our selection method) many galaxies, including many in the AGN region, are not. The depth of the SWIRE imaging appears sufficient to probe AGNs with NIR color properties spanning the entirety of the selection box.
Current usage metrics show cumulative count of Article Views (full-text article views including HTML views, PDF and ePub downloads, according to the available data) and Abstracts Views on Vision4Press platform.
Data correspond to usage on the plateform after 2015. The current usage metrics is available 48-96 hours after online publication and is updated daily on week days.
Initial download of the metrics may take a while.