Fig. 6
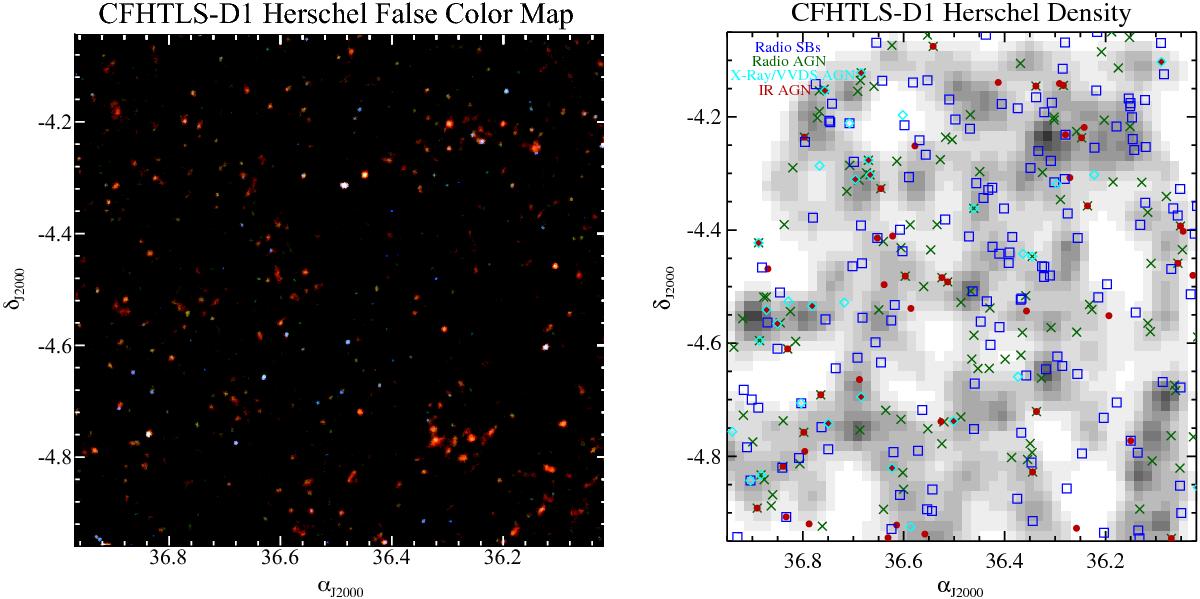
Left: false color image of the Herschel/SPIRE mosaic in the CFHTLS-D1 overlap region (see Sect. 2.1). The SPIRE 500 μm, 350 μm, and 250 μm images served as the RGB channels, respectively. Right: sky distribution of multiwavelength galaxies also detected with SPIRE plotted against the backdrop of a density map of the 1753 galaxies in our final SPIRE sample. The spatial density of the full SPIRE sample is a convolution of the true spatial distribution (left panel) and a number of metholodological and observational effects. Bright stars, which prevent both spectroscopy and high-quality photometric redshifts, account for the presence of most of the voids seen in the background density. This includes voids around areas of otherwise high densities of SPIRE-detected sources, such as the grouping seen in the left panel at [ αJ2000,δJ2000 ] ~ [ 36.28, −4.76 ].
Current usage metrics show cumulative count of Article Views (full-text article views including HTML views, PDF and ePub downloads, according to the available data) and Abstracts Views on Vision4Press platform.
Data correspond to usage on the plateform after 2015. The current usage metrics is available 48-96 hours after online publication and is updated daily on week days.
Initial download of the metrics may take a while.