Fig. 7
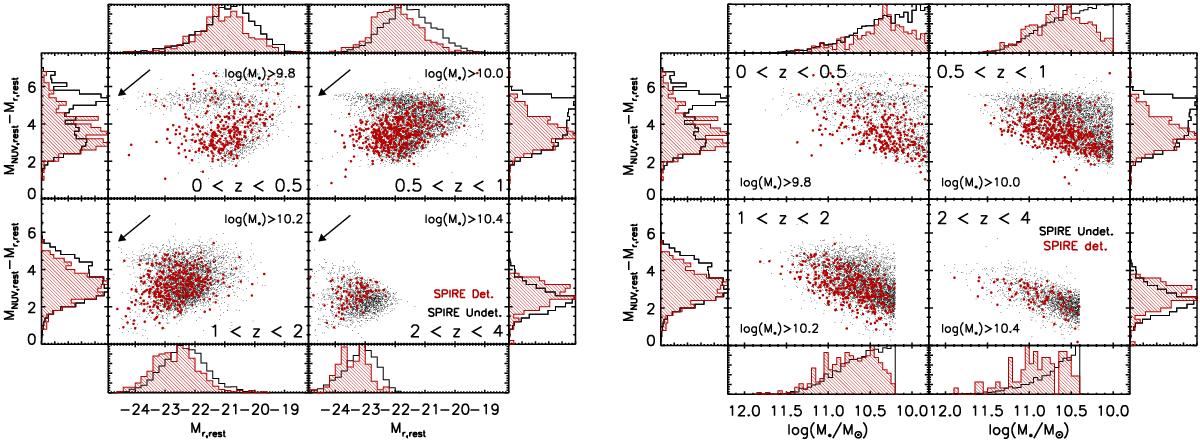
Rest-frame MNUV − Mr color magnitude (left) and color stellar mass (right) diagrams of the full SPIRE sample (filled red circles and dashed red histograms) and galaxies undetected in SPIRE (small black points and open black histograms). Galaxies are binned into four different redshift bins and histograms of each sample are normalized (such that the maximal value is unity) for each redshift bin. Only those galaxies detected at high significance in CFHT-WIRDS Ks-band imaging are shown in both panels. In each panel the sample is restricted to those galaxies with stellar masses above the stellar mass limit for each redshift range (given in each panel). The arrow denotes the change in color and (where appropriate) absolute magnitude for an extinction value of Es(B − V) ~ 0.3 using a Calzetti et al. (2000) extinction law. The arrow is vertical in the right panel because the measured extinction values are already incorporated into the SED-fitting process. The SPIRE-detected sample spans the full range of absolute magnitudes, stellar masses, and, surprisingly, colors in each redshift bin.
Current usage metrics show cumulative count of Article Views (full-text article views including HTML views, PDF and ePub downloads, according to the available data) and Abstracts Views on Vision4Press platform.
Data correspond to usage on the plateform after 2015. The current usage metrics is available 48-96 hours after online publication and is updated daily on week days.
Initial download of the metrics may take a while.