Fig. 8
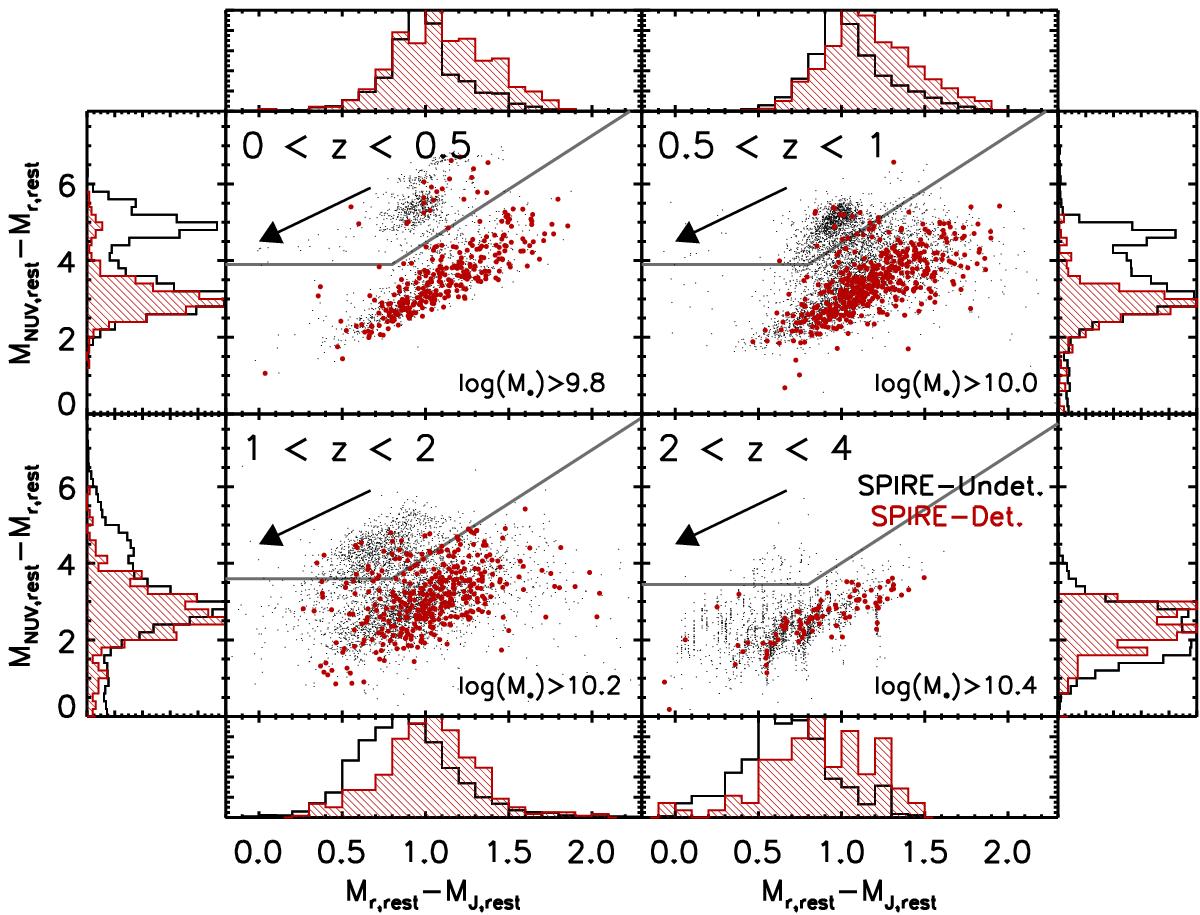
Rest-frame MNUV − Mr vs. Mr − MJ color–color diagram for both the full SPIRE sample and galaxies undetected in the SPIRE imaging. The gray lines in each panel divide quiescent galaxies (above the lines) from star-forming galaxies (below the line) and is determined using a modified version of the methodology employed by Ilbert et al. (2013). The meanings of colors and symbols are nearly identical to Fig. 7. The one exception is the histogram plotted along the ordinate in each panel, in which galaxies are projected into an “effective color” defined as the offset from the dividing line. This representation of the sample serves to largely mitigate extinction effects, and as such, a large fraction (~95%) of the full SPIRE sample are now in the phase space coincident with normal star-forming galaxies.
Current usage metrics show cumulative count of Article Views (full-text article views including HTML views, PDF and ePub downloads, according to the available data) and Abstracts Views on Vision4Press platform.
Data correspond to usage on the plateform after 2015. The current usage metrics is available 48-96 hours after online publication and is updated daily on week days.
Initial download of the metrics may take a while.