Fig. 9
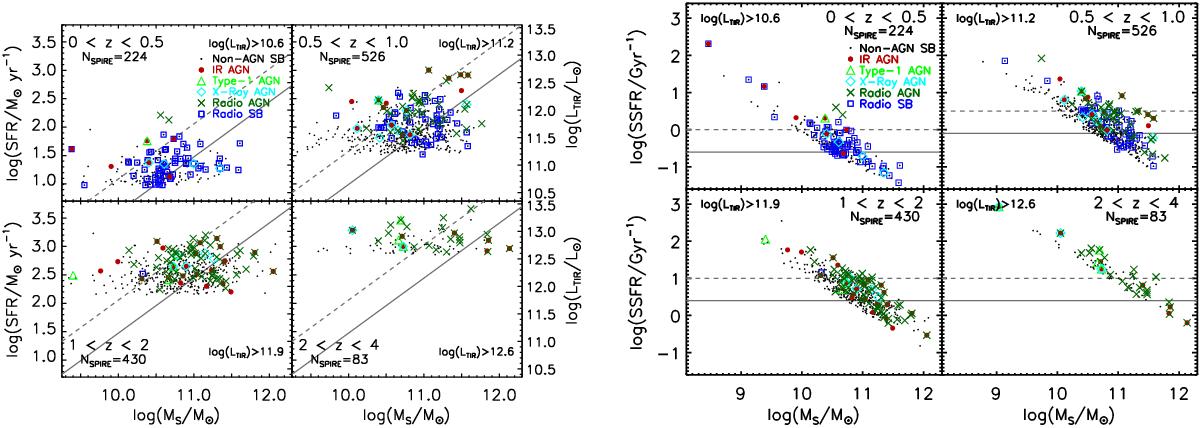
Left: total infrared (TIR)-derived SFR plotted against stellar mass for volume-limited samples of all optically matched galaxies detected in at least one SPIRE band at ≥3σ for four different redshift bins. LTIR is shown on the right ordinate for reference. Because the SFR conversion employs a Salpeter IMF, the stellar masses shown here are converted from a Chabrier to a Salpeter IMF. Black points represent galaxies detected in SPIRE, while galaxies detected in radio imaging and those galaxies hosting AGN are overplotted in larger symbols. The main sequence relationship for star-forming galaxies is adopted from E11 for galaxies at 0 <z< 0.5, an average of the relation in E11 and that relation of the lowest stellar mass bin of R11 for galaxies at 0.5 <z< 1, and the relation from the lowest stellar mass bin in R11 for galaxies at z> 1 and is plotted as a solid gray line. The dashed line denotes the transition point between galaxies classified as normal star forming to those classified as starbursts (4× the main sequence SSFR threshold). There is no evidence in three of the four redshift bins of a correlation between SFR and ℳ∗ to the depth of our SPIRE imaging. Right: specific SFR plotted against stellar mass for the same samples as the left panel. Symbols and lines are identical to the left panel. The dynamic range of Herschel is small in any given redshift bin while the stellar mass range is not, which leads to the observed trend.
Current usage metrics show cumulative count of Article Views (full-text article views including HTML views, PDF and ePub downloads, according to the available data) and Abstracts Views on Vision4Press platform.
Data correspond to usage on the plateform after 2015. The current usage metrics is available 48-96 hours after online publication and is updated daily on week days.
Initial download of the metrics may take a while.