Fig. 8
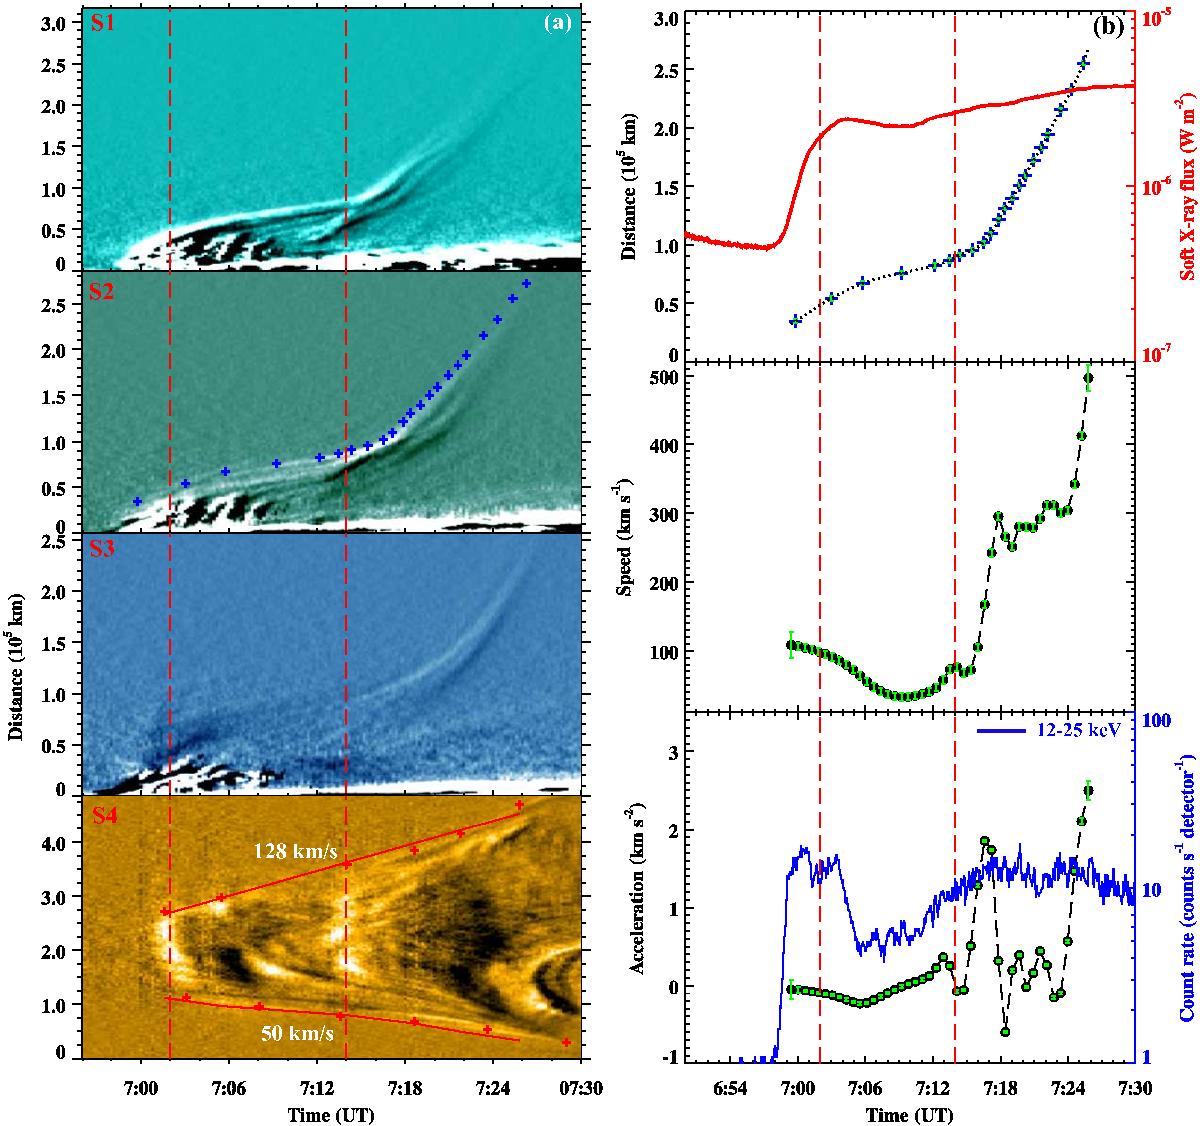
a) Space-time plots along slices S1, S2, S3, and S4 using the AIA 131, 94, 335, and 171 Å images. b) Top: height-time profile of the flux rope and GOES soft X-ray flux (red) in the 1−8 Å channel. Middle: speed profile derived from the height-time measurements of the flux rope. Bottom: acceleration profile of the flux rope plotted with RHESSI hard X-ray flux (blue) in the 12−25 keV energy channel. The two vertical dotted lines indicate the timing of the 171 Å brightenings and hard X-ray bursts.
Current usage metrics show cumulative count of Article Views (full-text article views including HTML views, PDF and ePub downloads, according to the available data) and Abstracts Views on Vision4Press platform.
Data correspond to usage on the plateform after 2015. The current usage metrics is available 48-96 hours after online publication and is updated daily on week days.
Initial download of the metrics may take a while.