Fig. 10
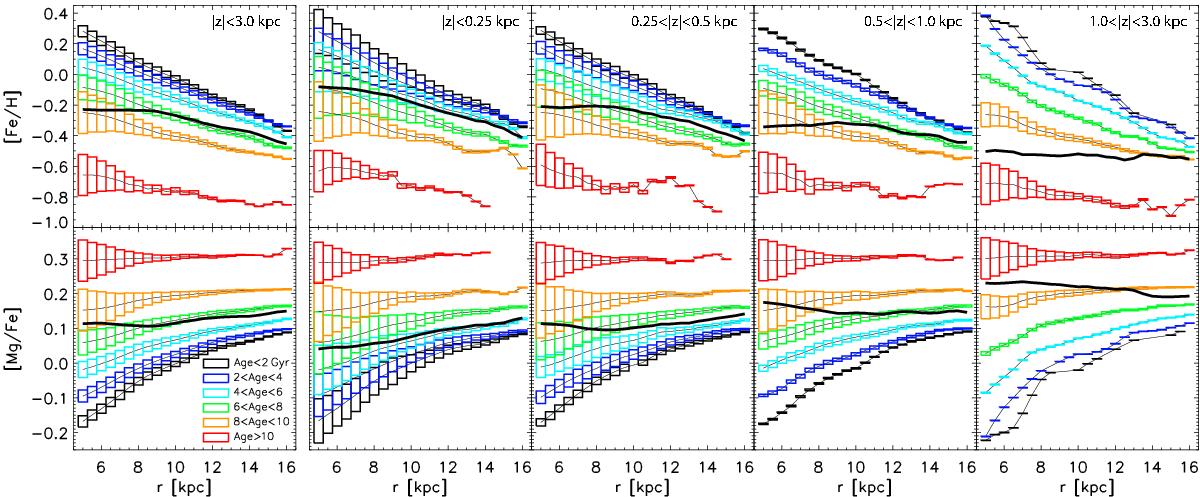
Variation of azimuthally averaged chemical gradients with distance from the disk midplane. Top row: thick black curves show the metallicity variation with Galactic radius for stellar samples at different distances from the disk midplane, as marked in each panel. Different colors correspond to different age groups as indicated in the bottom-left panel. The height of rectangular symbols reflects the density of each bin. The negative gradient seen in the total population (leftmost panel) is strongly flattened (and even reversed at r< 10 kpc) for the range 0.5 < | z | < 1.0 kpc. Bottom row: same as above but for [Mg/Fe]. Here the weak positive gradient for the total population (leftmost panel) turns negative as distance from the disk plane increases, although the gradient of each individual age-bin is positive. This figure illustrates that different mixtures of stellar ages (e.g., because of different slices in z) can give rise to a range of different [Fe/H] and [α/Fe] gradients.
Current usage metrics show cumulative count of Article Views (full-text article views including HTML views, PDF and ePub downloads, according to the available data) and Abstracts Views on Vision4Press platform.
Data correspond to usage on the plateform after 2015. The current usage metrics is available 48-96 hours after online publication and is updated daily on week days.
Initial download of the metrics may take a while.