Fig. 11
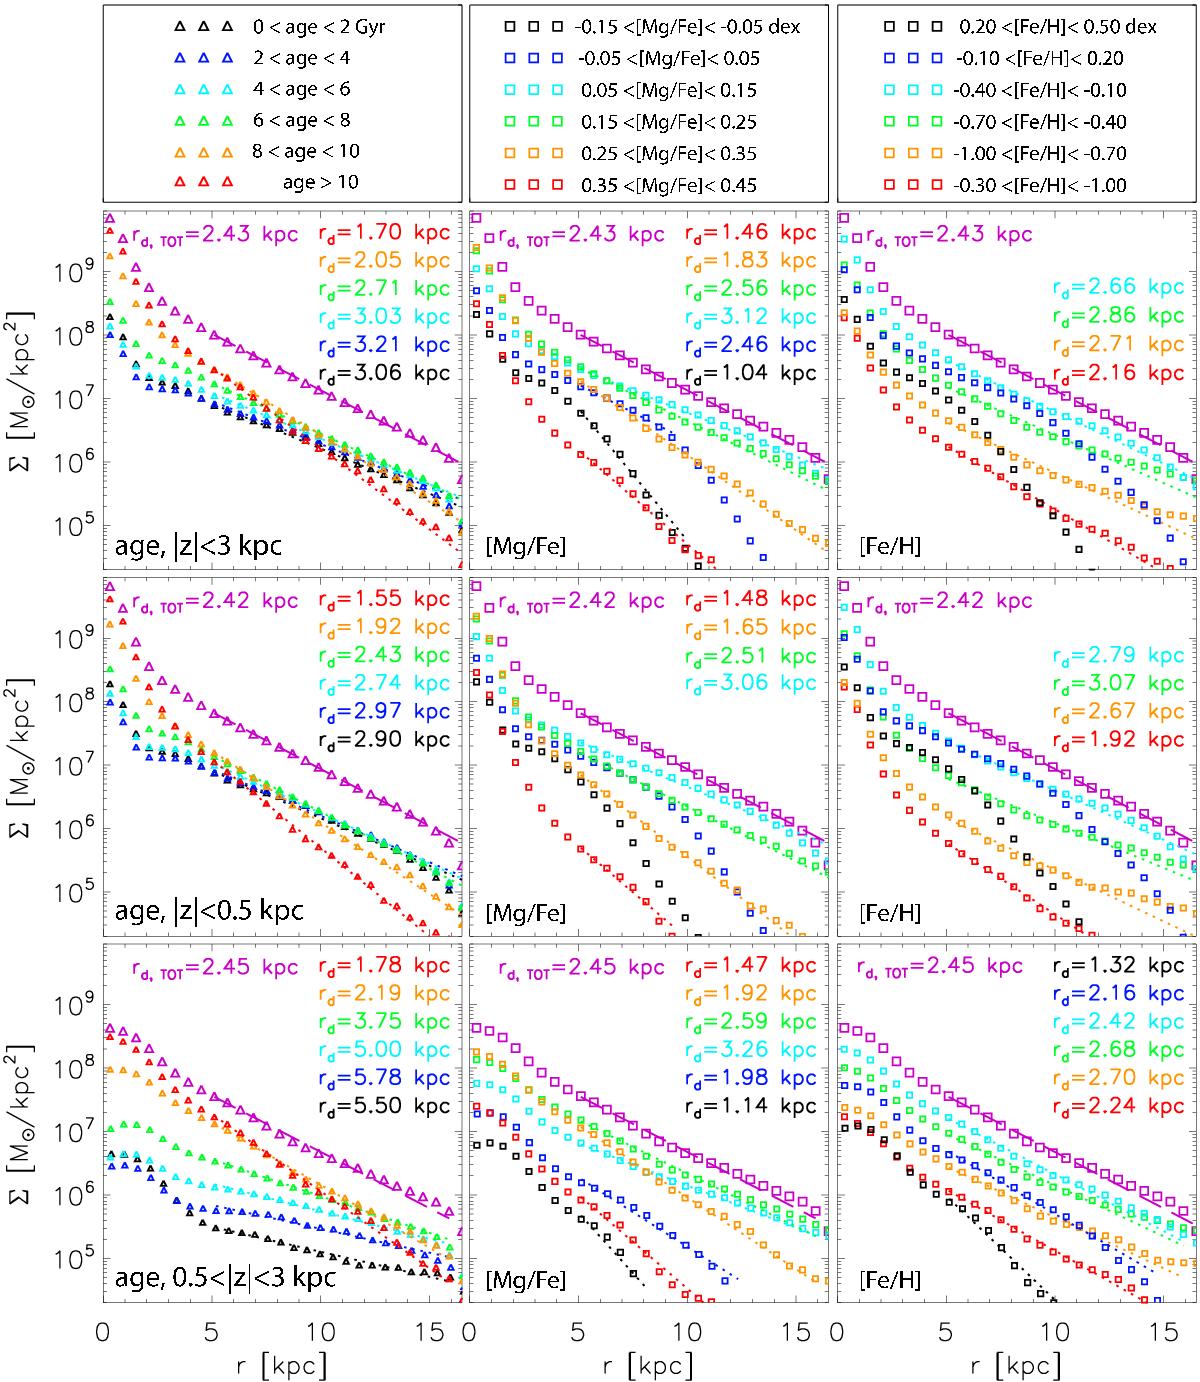
First row: stellar surface density as a function of Galactic radius for stars with distance from the midplane | z | < 3 kpc. In addition to the total mass (pink symbols), subsamples grouped by narrow bins of age (left panel), [Mg/Fe] (middle panel), and [Fe/H] (right panel) are shown by different colors, as indicated. The corresponding bin values are shown on top of the figure. The color–coded values in each panel indicate the scale-length, rd, fitted as a single exponential in the range 5 <r< 16.5 kpc, shown by the dotted lines (dashed pink line for the total population). Decrease in scale-length is seen with increasing age for all three distances from the disk plane. While single exponential fits are appropriate for mono-age populations (left column), stars binned by [Mg/Fe] or [Fe/H] show truncation (a change to a steeper exponential) around 5–10 kpc for the younger stars (black and blue curves). Second row: same as above, but for stars with | z | < 0.5 kpc. Third row: same as above, but for stars with 0.5 < | z | < 3 kpc. At this distance from the disk plane (similar to SEGUE G-dwarfs), the breaks in the high-[Fe/H] and low-[Mg/Fe] profiles are mostly gone.
Current usage metrics show cumulative count of Article Views (full-text article views including HTML views, PDF and ePub downloads, according to the available data) and Abstracts Views on Vision4Press platform.
Data correspond to usage on the plateform after 2015. The current usage metrics is available 48-96 hours after online publication and is updated daily on week days.
Initial download of the metrics may take a while.