Fig. 3
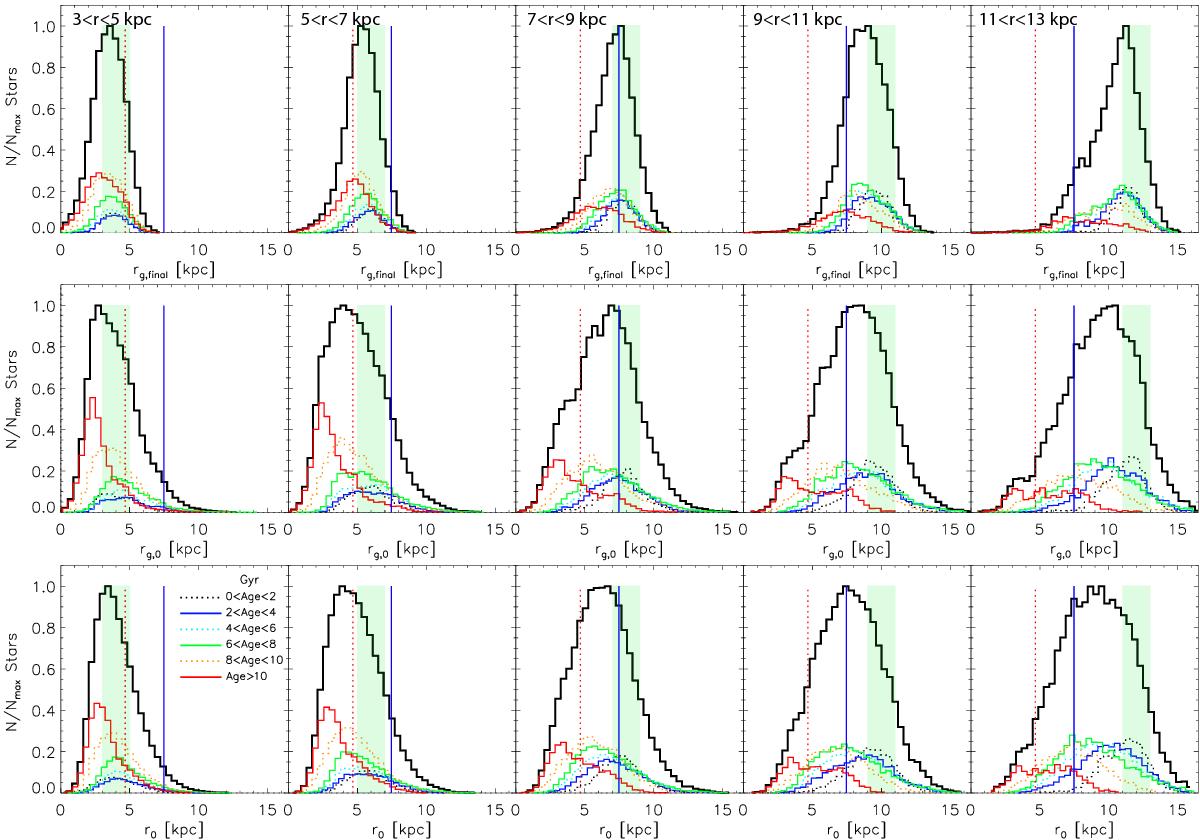
Comparison among the distributions of final guiding radii (rg,final, top row), birth guiding radii (rg,0, middle row), and actual birth radii (r0, bottom row) for stars of different age groups ending up in a given radial bin, as indicated. Five final radial bins are considered. Solid black curves plot the total distribution, while the color–coded curves show the distributions of stars in five different age groups. The dotted-red and solid-blue vertical lines indicate the positions of the bar’s CR and OLR estimated at the final time. The width and peak shift of the total distributions are shown in Fig. 4. The significantly narrower distributions of final guiding radii (compared to rg,0) in all age-groups indicate that migration is important for stars of all ages.
Current usage metrics show cumulative count of Article Views (full-text article views including HTML views, PDF and ePub downloads, according to the available data) and Abstracts Views on Vision4Press platform.
Data correspond to usage on the plateform after 2015. The current usage metrics is available 48-96 hours after online publication and is updated daily on week days.
Initial download of the metrics may take a while.