Fig. 4
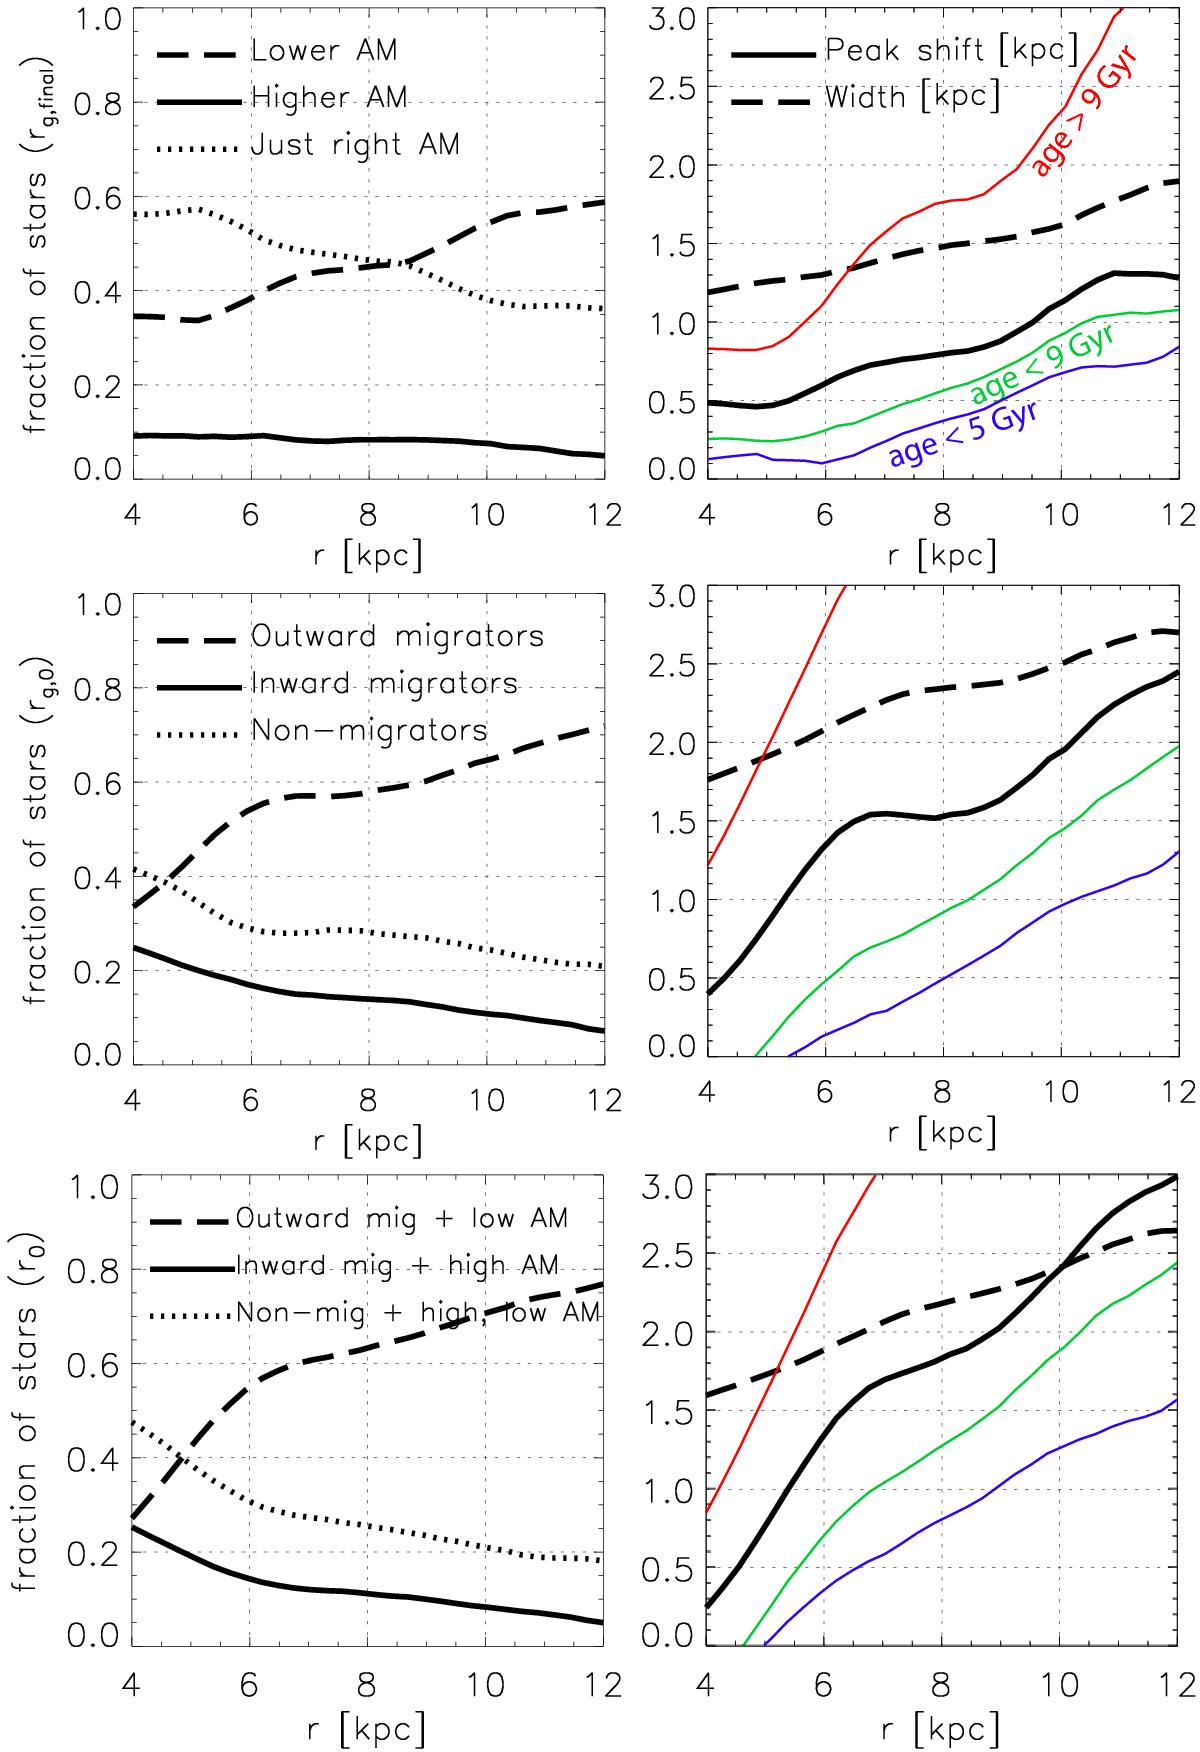
Left column: variation with Galactic radius of the fraction of stars arriving from the inner disk, from the outer disk, and those native to a given radius. Right column: peak shift and width of the total distributions (black curves). The peak shift of stars born before (red) and after (blue) the last massive mergers are also shown. From top to bottom, different rows show the above quantities estimated for the final guiding radius (rg,final), the guiding birth radius (rg,0), and the actual birth radius (r0), as in Fig. 3. The peak shift is defined as the difference between the median final radius and the peak of the total distributions shown in Fig. 3. The width is estimated as the standard deviation of the total distribution in each bin. For this figure we consider 30 overlapping radial bins instead of the five used in Fig. 3, in order to better exhibit the radial variations.
Current usage metrics show cumulative count of Article Views (full-text article views including HTML views, PDF and ePub downloads, according to the available data) and Abstracts Views on Vision4Press platform.
Data correspond to usage on the plateform after 2015. The current usage metrics is available 48-96 hours after online publication and is updated daily on week days.
Initial download of the metrics may take a while.