Fig. 5
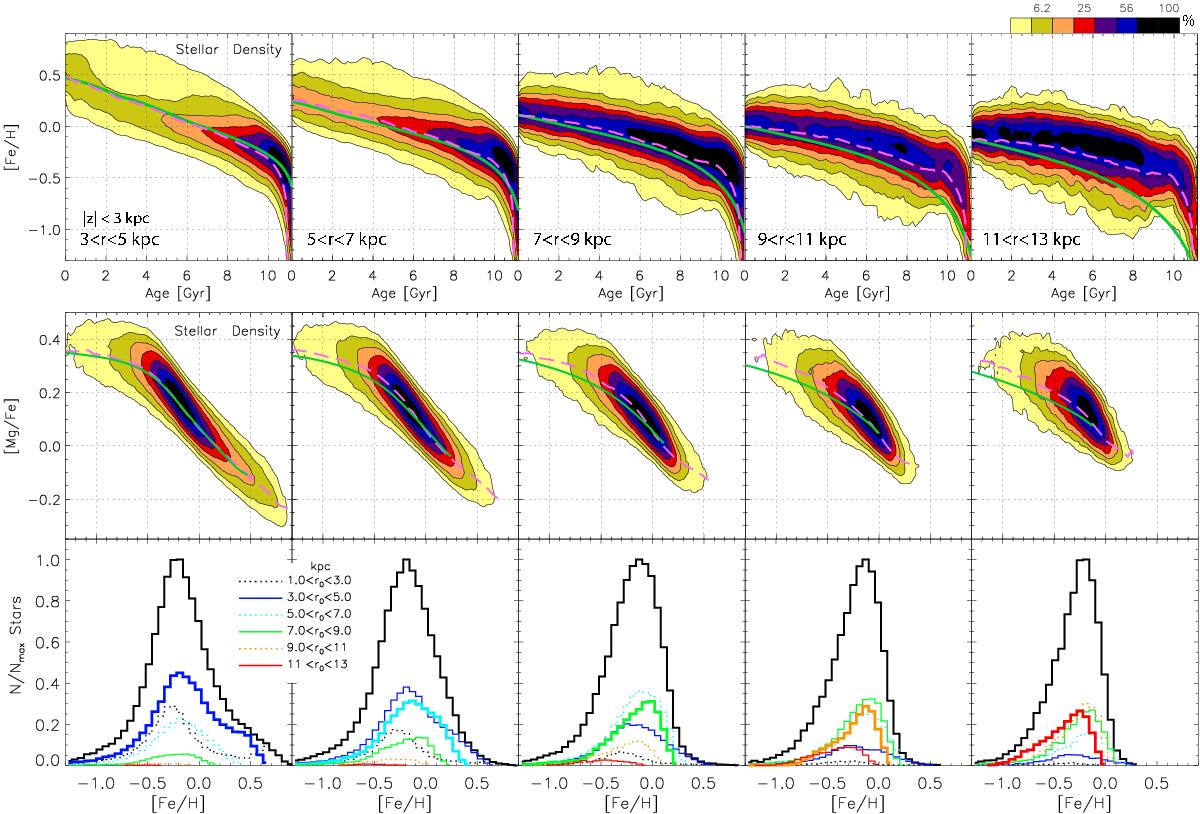
Top row: color contours show the age-[Fe/H] relation for the same disk annuli as in Fig. 3. The middle row (7 <r< 9 kpc) corresponds to the solar neighborhood. The input chemistry, native to each bin, is shown by the solid-green curve. The dashed-pink curve indicates the mean [Fe/H] binned by age. The gradient is only weakly affected at and inward of the solar circle. Second row: [Fe/H]-[Mg/Fe] stellar distributions. As in the top row, the input chemistry is shown by the solid-green curve. Third row: metallicity distributions. In addition to the total sample at each radial bin, the color–coded curves indicate groups born at different Galactic radii. In each panel, the thick curve shows the stars born in that given radial bin.
Current usage metrics show cumulative count of Article Views (full-text article views including HTML views, PDF and ePub downloads, according to the available data) and Abstracts Views on Vision4Press platform.
Data correspond to usage on the plateform after 2015. The current usage metrics is available 48-96 hours after online publication and is updated daily on week days.
Initial download of the metrics may take a while.