Fig. 8
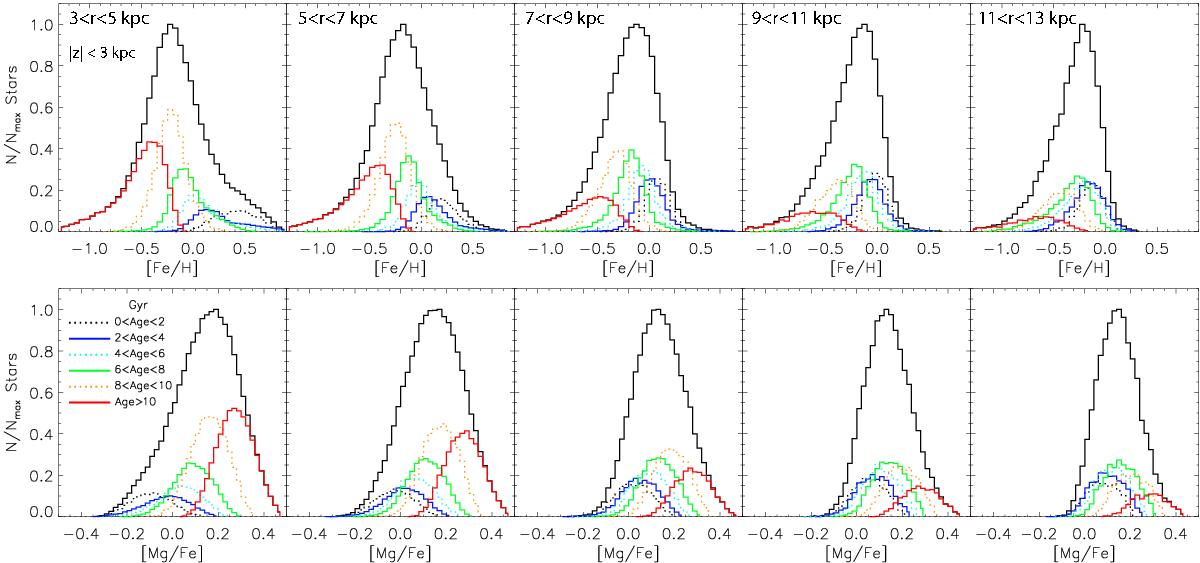
Top: metallicity distributions at different distances from the Galactic center. In each panel the solid black histogram shows the total sample (same as colored lines in Fig. 7, left), while various colors correspond to different age groups as indicated in the bottom left panel. It is remarkable that despite the strong decrease in the fraction of old stars (red and orange lines), the metal-poor tail remains practically identical for samples at different radii (as seen in Fig. 7, left). While in the central regions it is dominated by the oldest stars, in the outer disk it is a mixture of all ages. Bottom: same as above but for [Mg/Fe]. Here the decrease in the fraction of old stars gives a significant effect in the α-rich wing of the distribution (see Fig. 7, right).
Current usage metrics show cumulative count of Article Views (full-text article views including HTML views, PDF and ePub downloads, according to the available data) and Abstracts Views on Vision4Press platform.
Data correspond to usage on the plateform after 2015. The current usage metrics is available 48-96 hours after online publication and is updated daily on week days.
Initial download of the metrics may take a while.