Fig. 1
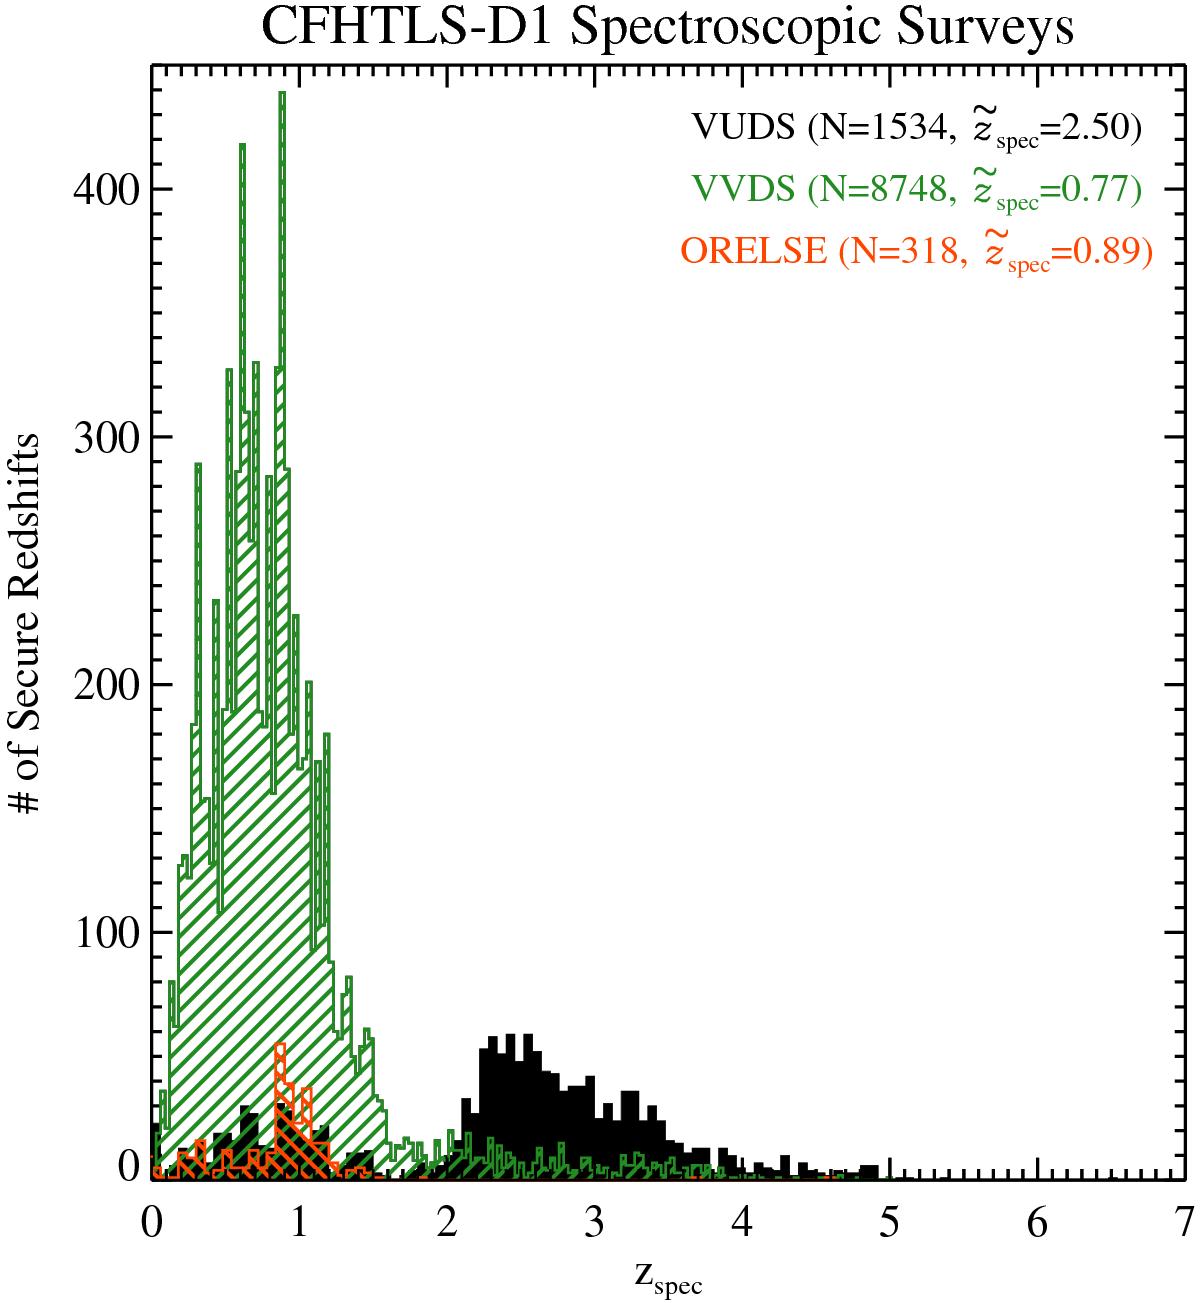
Spectroscopic redshift distribution of the 10 600 unique objects with secure spectroscopic redshifts (see text) in the CFHTLS-D1 field. The two lower redshift surveys, VVDS (Le Fèvre et al. 2013) and ORELSE (Lubin et al. 2009), are shown as hashed green and orange histograms, respectively. The higher redshift VUDS (Le Fèvre et al. 2014) objects are shown as a black filled histogram. The number of objects with secure spectroscopic redshifts coming from each survey along with the median zspec of each sample is shown in the top right corner. For the sake of clarity, the bin size of the histograms for the VUDS and ORELSE objects are twice that of the VVDS. Though it is not apparent from the diagram, there is a tail of galaxies with zspec> 5 confirmed from the VUDS survey.
Current usage metrics show cumulative count of Article Views (full-text article views including HTML views, PDF and ePub downloads, according to the available data) and Abstracts Views on Vision4Press platform.
Data correspond to usage on the plateform after 2015. The current usage metrics is available 48-96 hours after online publication and is updated daily on week days.
Initial download of the metrics may take a while.