Fig. 2
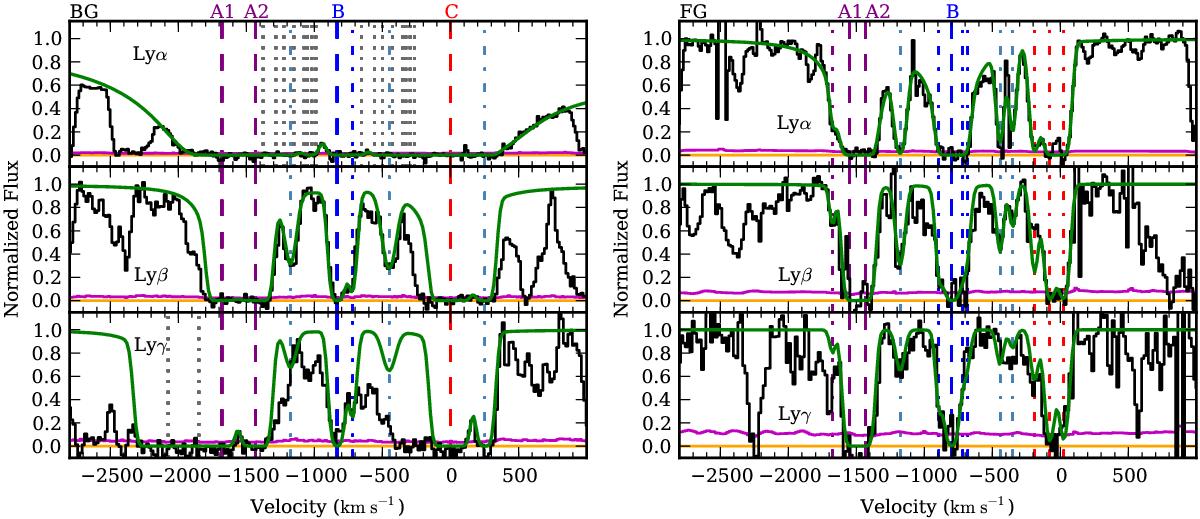
Fits to Lyα (top), Lyβ (middle), and Lyγ (bottom) H i absorptions in the BG (left) and FG (right) spectra. Dashed purple, blue, and red lines mark the log N(H i) > 18.0 components in regions A, B, and C, while dash-dotted purple, blue, and red lines indicate the weaker components within the respective regions. Dash-dotted blue-gray lines signal low column density components between the three main regions that are also part of the absorption structure. Dotted gray lines in the BG-Lyα panel indicate blended components from Si iiλλ1190, 1193 absorptions associated with a z ≃ 2.75 DLA. Zero velocity is relative to the BG-C system redshift, z = 2.6894, and the 1-σ error on the flux is shown in magenta.
Current usage metrics show cumulative count of Article Views (full-text article views including HTML views, PDF and ePub downloads, according to the available data) and Abstracts Views on Vision4Press platform.
Data correspond to usage on the plateform after 2015. The current usage metrics is available 48-96 hours after online publication and is updated daily on week days.
Initial download of the metrics may take a while.