Fig. 6
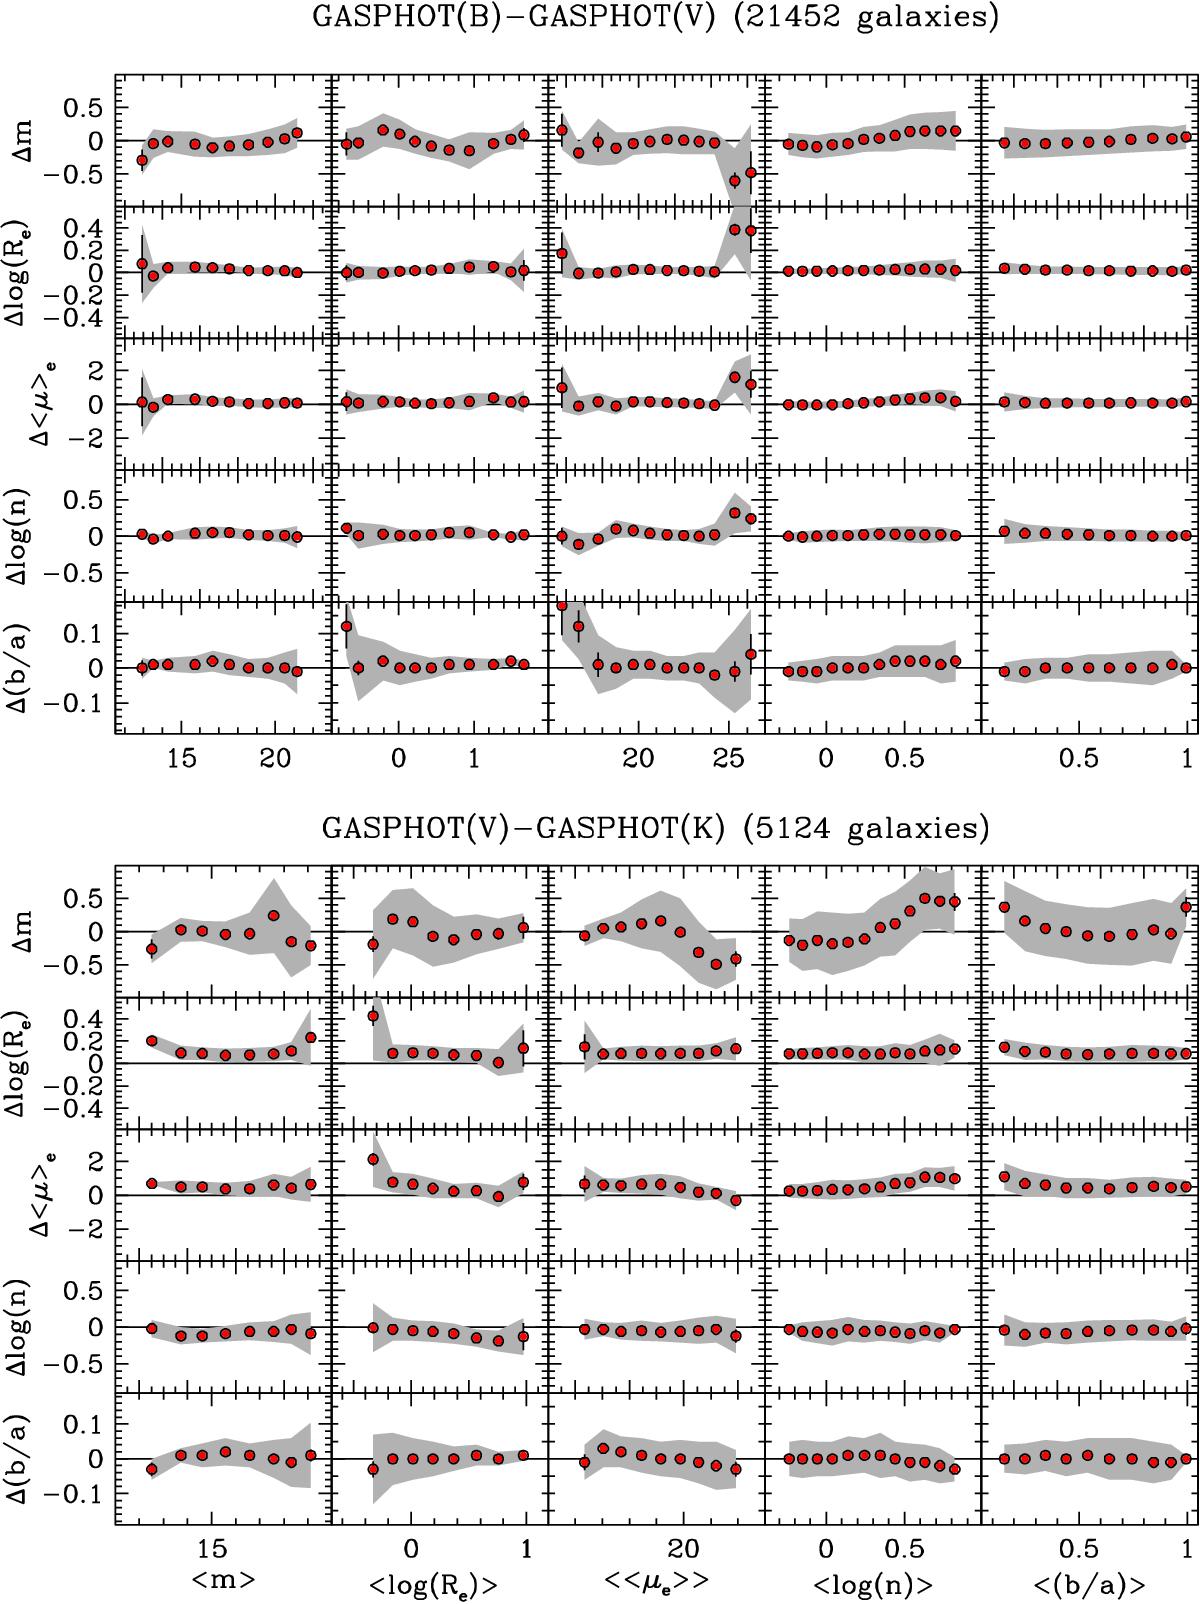
Comparison among various structural parameters obtained by GASPHOT in the different bands. The upper panels refer to the B vs. V band comparison, while the lower panels illustrate the V vs. K band comparison. The differences between parameters in different bands are plotted vs. the parameters themselves, averaged between the filters under comparison. The Δm and Δ⟨ μ ⟩ edifferences are normalized by removing the average colors (see text). As in the previous figures, the error bars represent the uncertainties of the median values of the differences in each bin, while the shaded bands give the semi-interquartile ranges of the deviation distributions.
Current usage metrics show cumulative count of Article Views (full-text article views including HTML views, PDF and ePub downloads, according to the available data) and Abstracts Views on Vision4Press platform.
Data correspond to usage on the plateform after 2015. The current usage metrics is available 48-96 hours after online publication and is updated daily on week days.
Initial download of the metrics may take a while.