Fig. 6
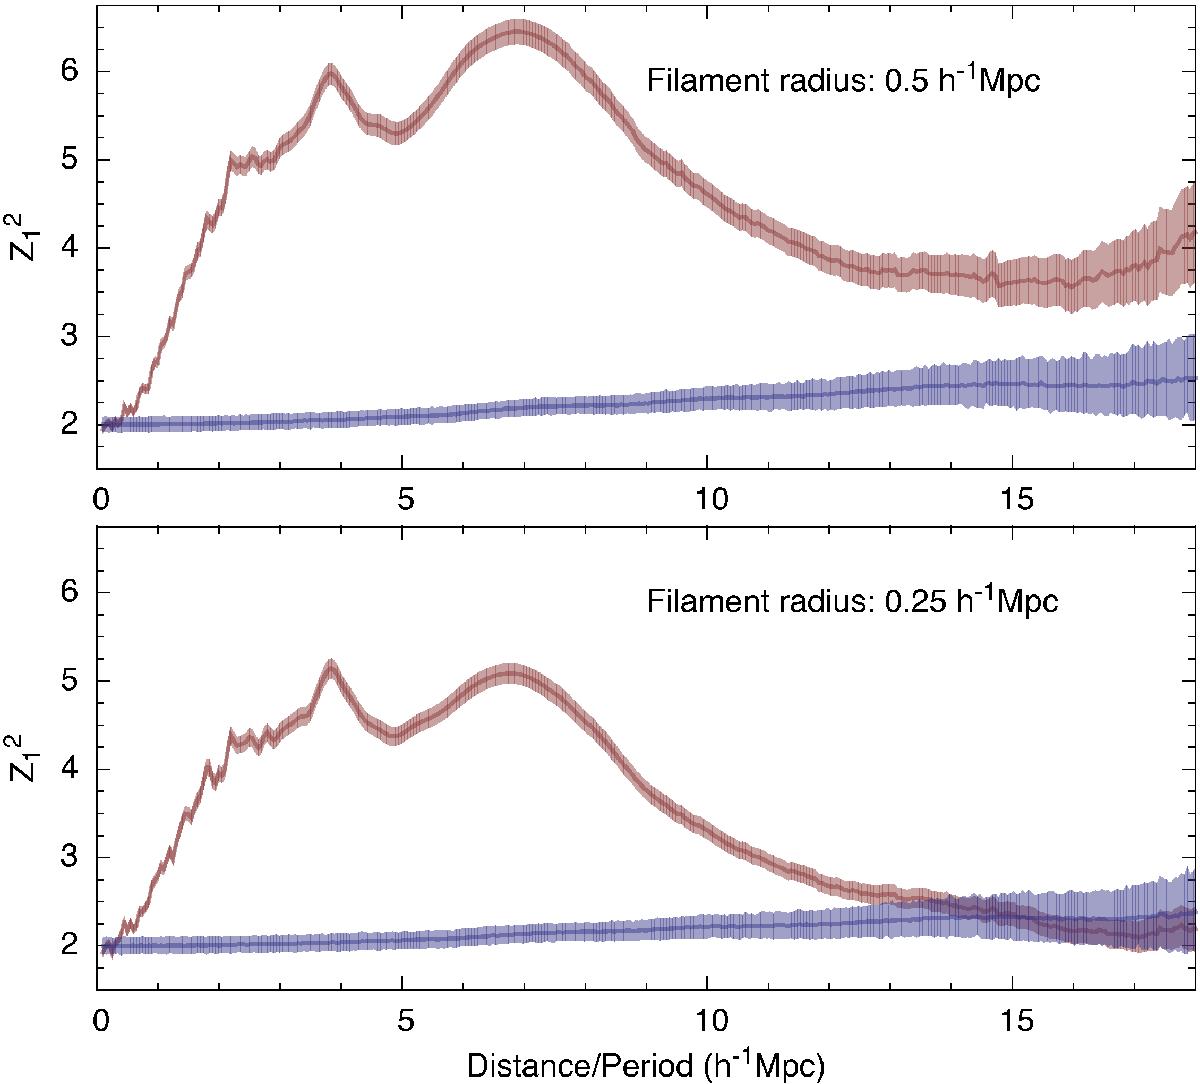
Dependence of the Rayleigh (Z-squared) statistic ![]() on distance (period). The upper panel shows the results for galaxies closer than 0.5 h-1 Mpc to the filament axis and the lower panel shows the results for galaxies closer than 0.25 h-1 Mpc. The red line shows the
on distance (period). The upper panel shows the results for galaxies closer than 0.5 h-1 Mpc to the filament axis and the lower panel shows the results for galaxies closer than 0.25 h-1 Mpc. The red line shows the ![]() statistic together with the jackknife 95% confidence estimate. The blue line shows the results from Monte Carlo simulations for the null hypothesis together with the 95% confidence limits.
statistic together with the jackknife 95% confidence estimate. The blue line shows the results from Monte Carlo simulations for the null hypothesis together with the 95% confidence limits.
Current usage metrics show cumulative count of Article Views (full-text article views including HTML views, PDF and ePub downloads, according to the available data) and Abstracts Views on Vision4Press platform.
Data correspond to usage on the plateform after 2015. The current usage metrics is available 48-96 hours after online publication and is updated daily on week days.
Initial download of the metrics may take a while.