Fig. 2
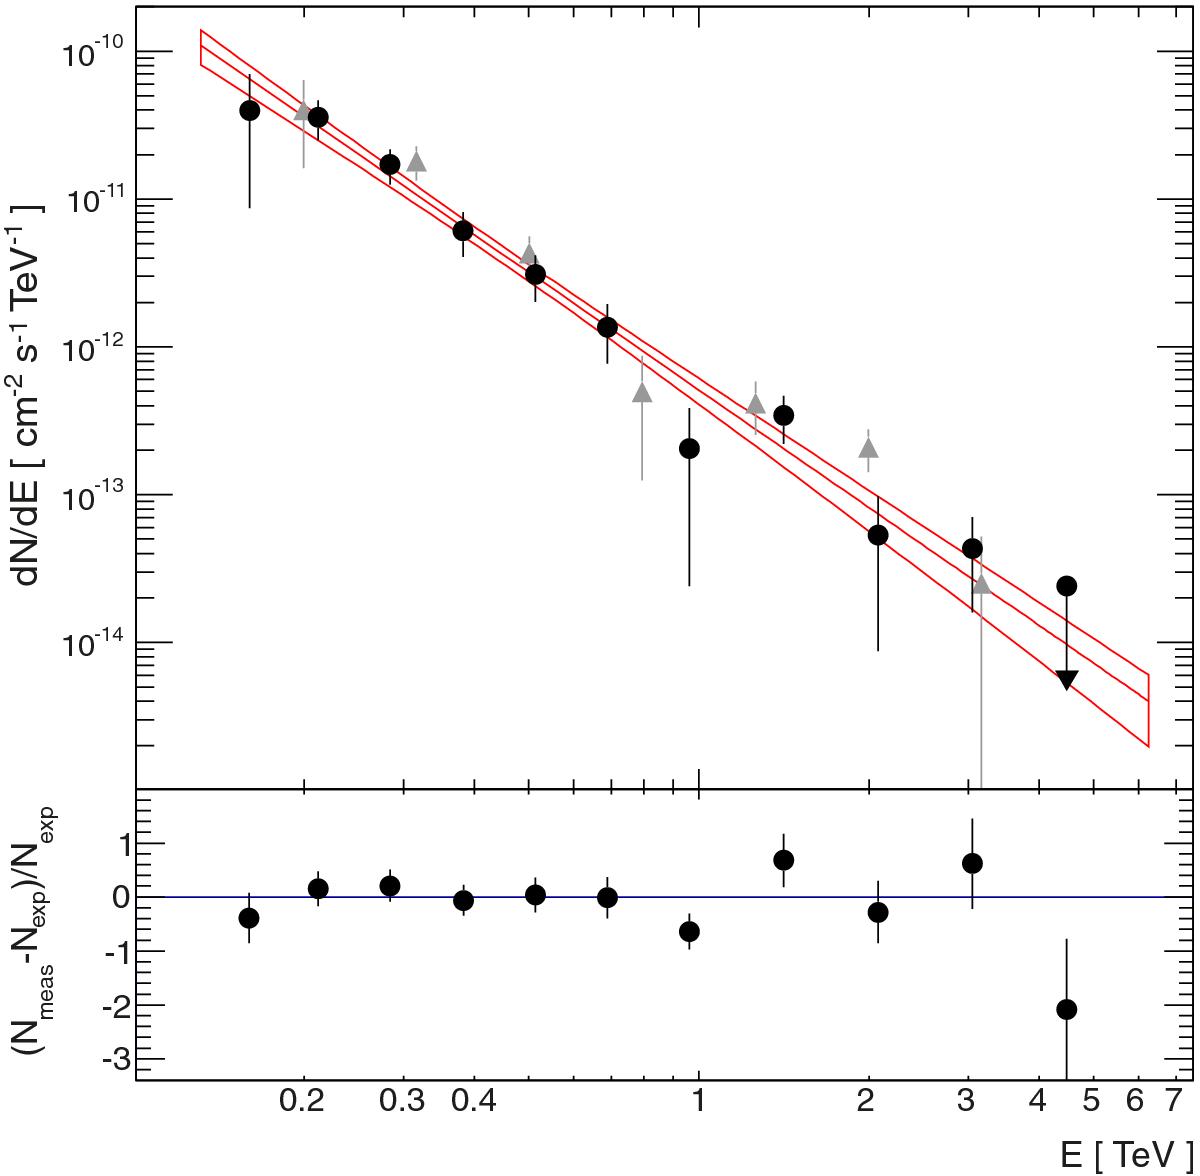
Differential VHE γ-ray spectrum and corresponding butterfly of AP Librae as derived with the Model analysis. Uncertainties on the spectral points are given at 1σ, i.e., at the 68.3% confidence level, and upper limits are computed at the 99% confidence level. The residuals, which are the difference between the measured and expected number of γ rays in a bin divided by the expected number of γ rays, are shown in the lower panel. The light gray points in the upper plot represent the spectrum derived as a cross-check with the Hillas analysis. Errors are statistical only.
Current usage metrics show cumulative count of Article Views (full-text article views including HTML views, PDF and ePub downloads, according to the available data) and Abstracts Views on Vision4Press platform.
Data correspond to usage on the plateform after 2015. The current usage metrics is available 48-96 hours after online publication and is updated daily on week days.
Initial download of the metrics may take a while.