Fig. 3
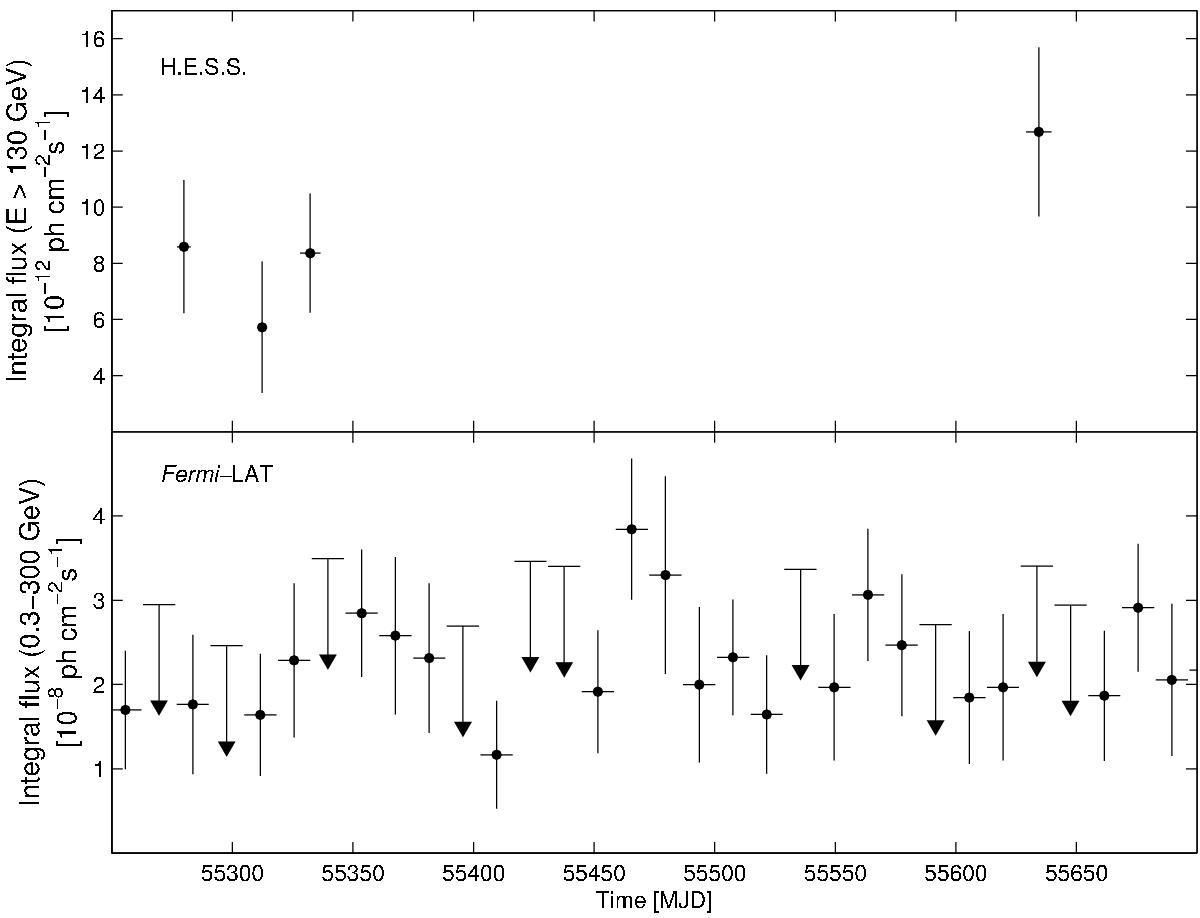
Light curves derived from the observations described in Sect. 2 from MJD 55 250 to MJD 55 700 (corresponding to the H.E.S.S. measurements). The top panel presents the H.E.S.S. integral flux for E> 130 GeV where the horizontal bars represent the observing duration elapsed between the two successive full moon periods when H.E.S.S. observed the target. The bottom panel gives the Fermi-LAT 300 MeV–300 GeV flux, with 95% confidence level upper limits for segments where TS < 10 and the horizontal bars show the 14 day Fermi-LAT integration times. This sample is typical from what was seen throughout the quiescent state.
Current usage metrics show cumulative count of Article Views (full-text article views including HTML views, PDF and ePub downloads, according to the available data) and Abstracts Views on Vision4Press platform.
Data correspond to usage on the plateform after 2015. The current usage metrics is available 48-96 hours after online publication and is updated daily on week days.
Initial download of the metrics may take a while.