Free Access
Fig. 6
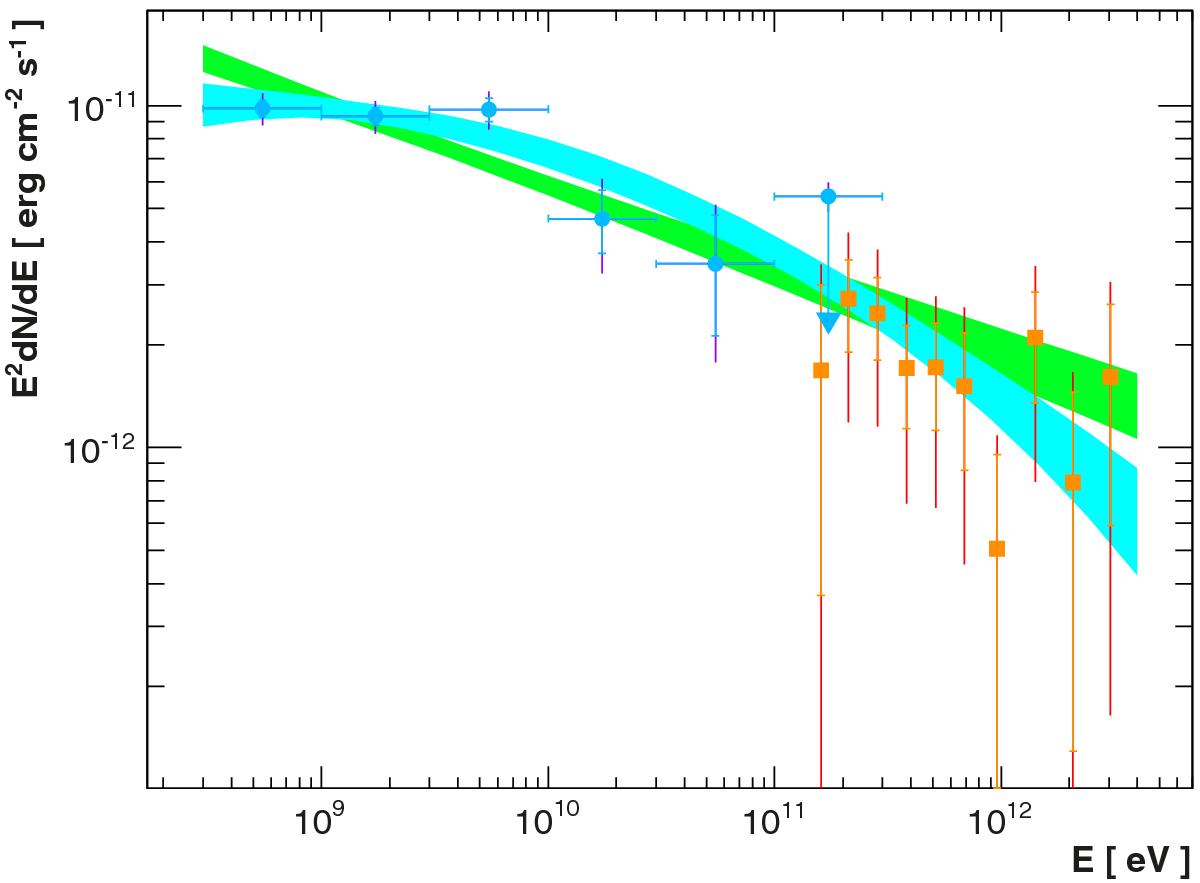
γ-ray SED of AP Librae from Fermi-LAT (blue circles) and H.E.S.S. (orange squares). The green and blue area represent the 68% error contour of the power-law and log-parabola fit to the HE–VHE data.
Current usage metrics show cumulative count of Article Views (full-text article views including HTML views, PDF and ePub downloads, according to the available data) and Abstracts Views on Vision4Press platform.
Data correspond to usage on the plateform after 2015. The current usage metrics is available 48-96 hours after online publication and is updated daily on week days.
Initial download of the metrics may take a while.