Free Access
Fig. 1
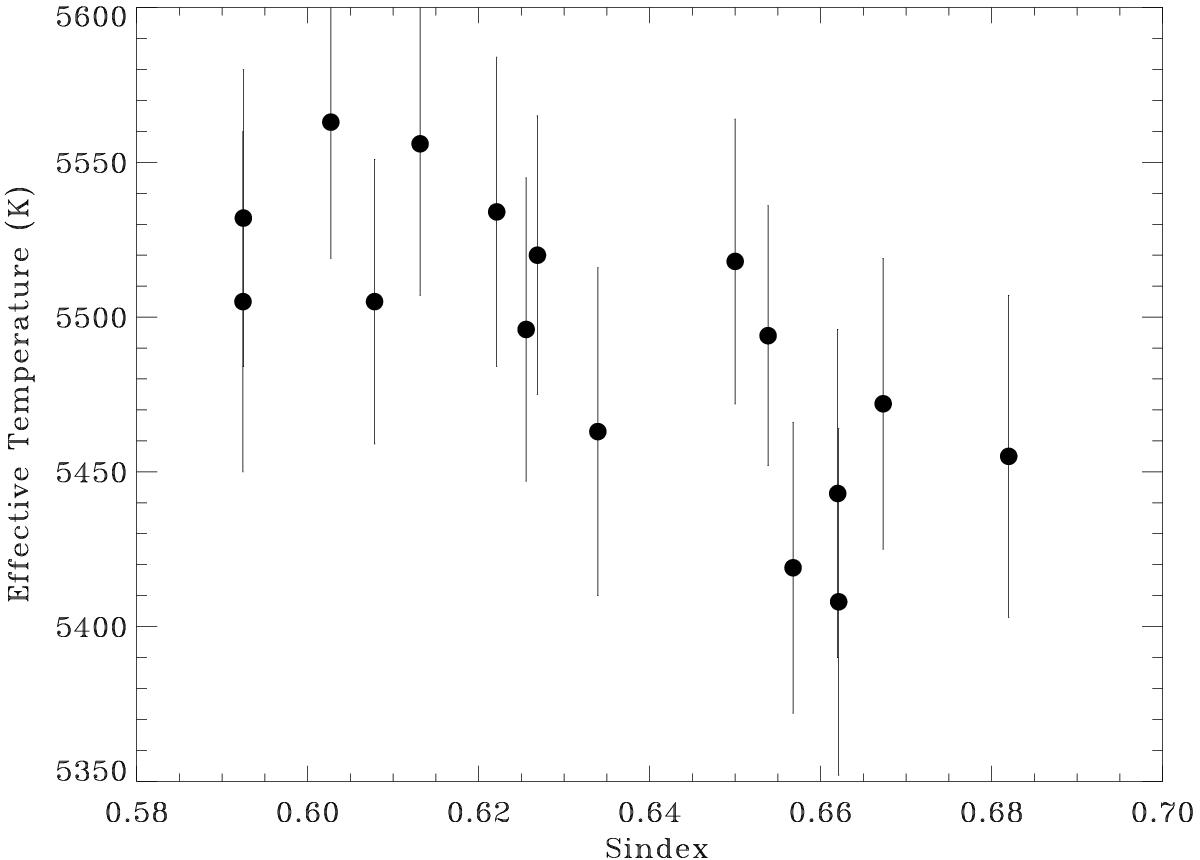
Variations in effective temperature as measured by applying ARES on HARPS spectra of HIP 32235. The temperature is displayed as a function of S index chromospheric emission.
Current usage metrics show cumulative count of Article Views (full-text article views including HTML views, PDF and ePub downloads, according to the available data) and Abstracts Views on Vision4Press platform.
Data correspond to usage on the plateform after 2015. The current usage metrics is available 48-96 hours after online publication and is updated daily on week days.
Initial download of the metrics may take a while.