Fig. 10
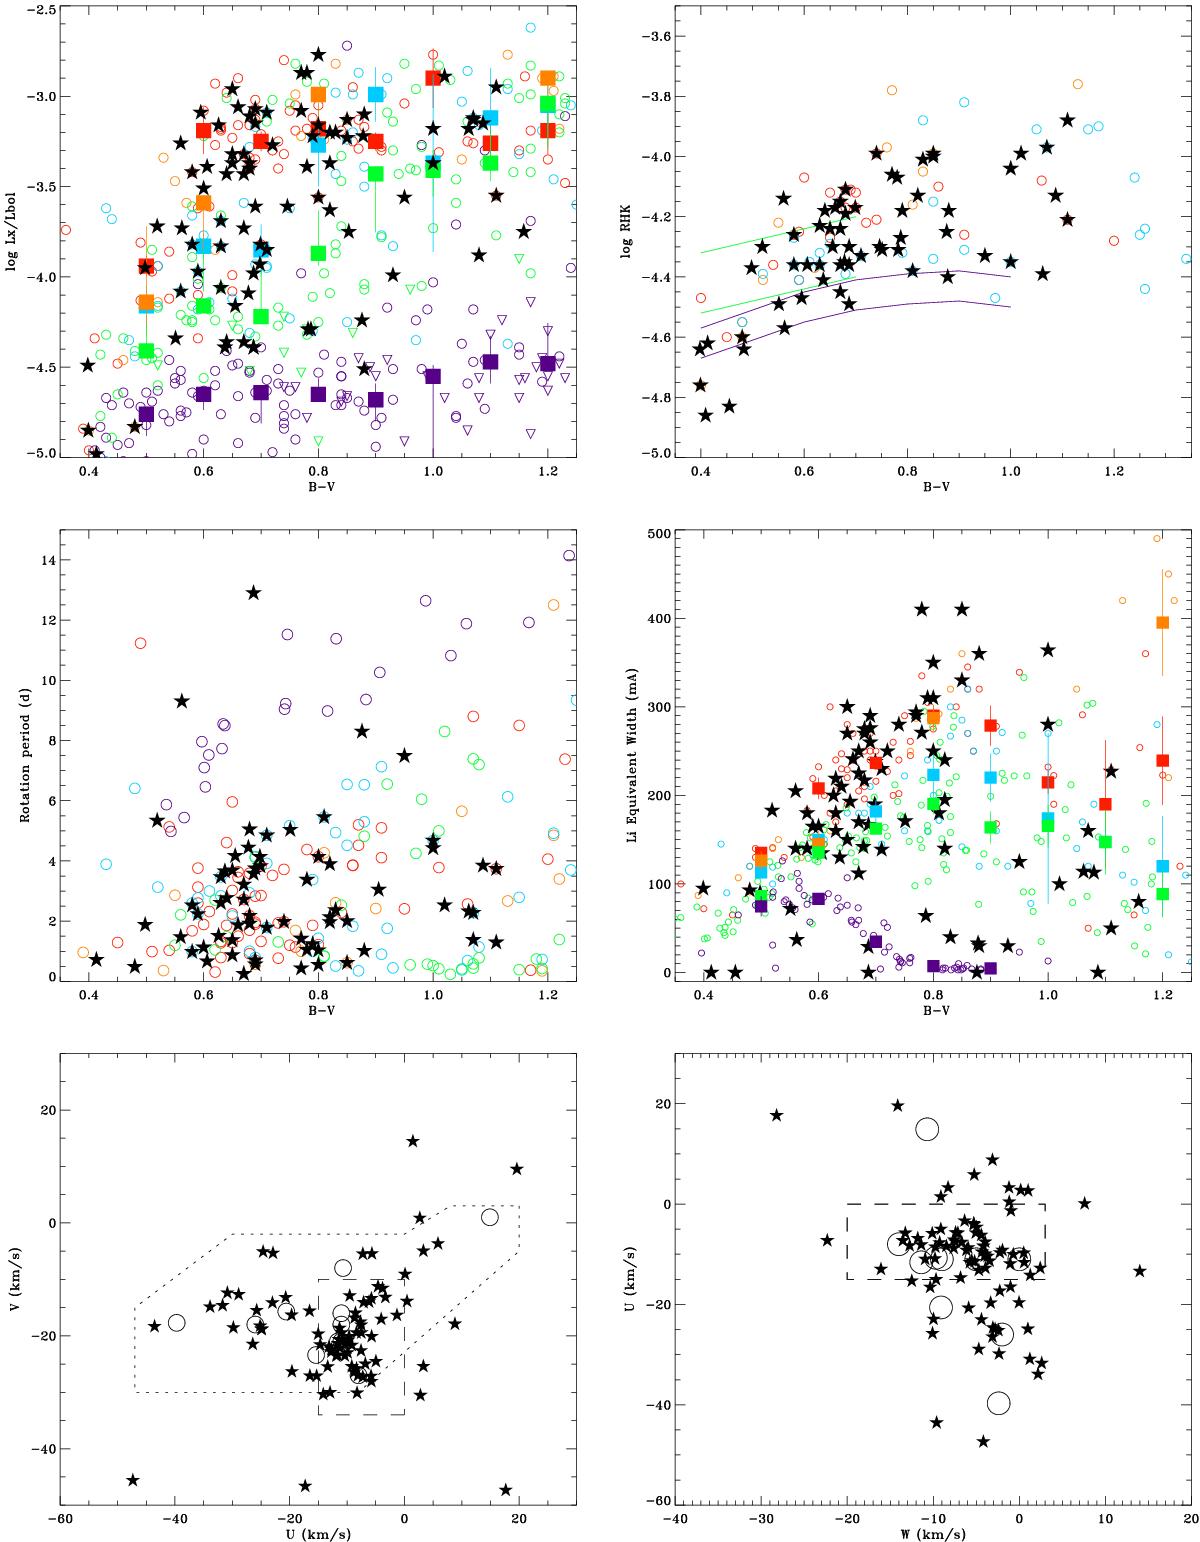
Age indicators for the stars in the sample. From top-left: RX = log LX/Lbol vs. B − V; log RHK vs. B − V; rotation period vs. B − V; lithium equivalent width vs. B − V; U vs. V space velocities; and U vs. W space velocities. In all the panels, the black stars represent the targets. In the RX, log RHK, rotation period, and lithium plots, orange circles represent β Pic MG; red circles: Tucana-Columba-Carina MG; light blue circles: AB Dor MG; green circles: Pleiades OC; purple circles: Hyades OC. In the RX vs. B − V and EW Li vs. B − V panels, the filled squares represent the median value of RX and EW Li for the corresponding color bin. In the log RHK plot, green and purple lines represent the locus populated by Pleiades and Hyades stars, respectivey. In the latter two panels, the positions of some young moving groups are marked as open circles. The dashed-line box in both panels is the locus of the Nearby Young Population as defined in Zuckerman & Song (2004). The dotted contours in the U vs. V plot show the locus of kinematically young stars proposed by Montes et al. (2001).
Current usage metrics show cumulative count of Article Views (full-text article views including HTML views, PDF and ePub downloads, according to the available data) and Abstracts Views on Vision4Press platform.
Data correspond to usage on the plateform after 2015. The current usage metrics is available 48-96 hours after online publication and is updated daily on week days.
Initial download of the metrics may take a while.