Fig. 13
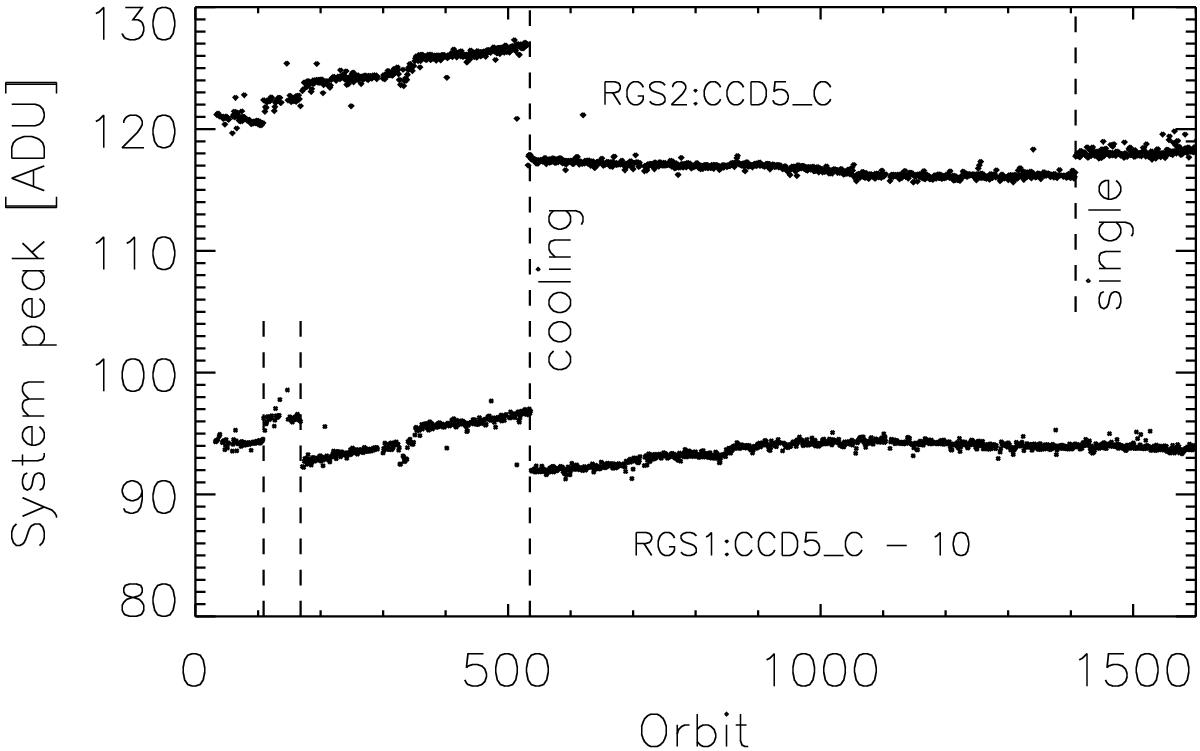
Evolution of system peak for one node of CCD5 in RGS1 and in RGS2 (other CCDs show a similar behavior). The sudden increase of the peak around orbit 110 (most prominent in RGS1) is due to a solar flare, while the drop around orbit 168 (also indicated for RGS1) is due to the change in bias setting. Cooling lowers the system peak around orbit 532, while the single node readout in orbit 1408 increases the RGS2 system peak.
Current usage metrics show cumulative count of Article Views (full-text article views including HTML views, PDF and ePub downloads, according to the available data) and Abstracts Views on Vision4Press platform.
Data correspond to usage on the plateform after 2015. The current usage metrics is available 48-96 hours after online publication and is updated daily on week days.
Initial download of the metrics may take a while.