Fig. 7
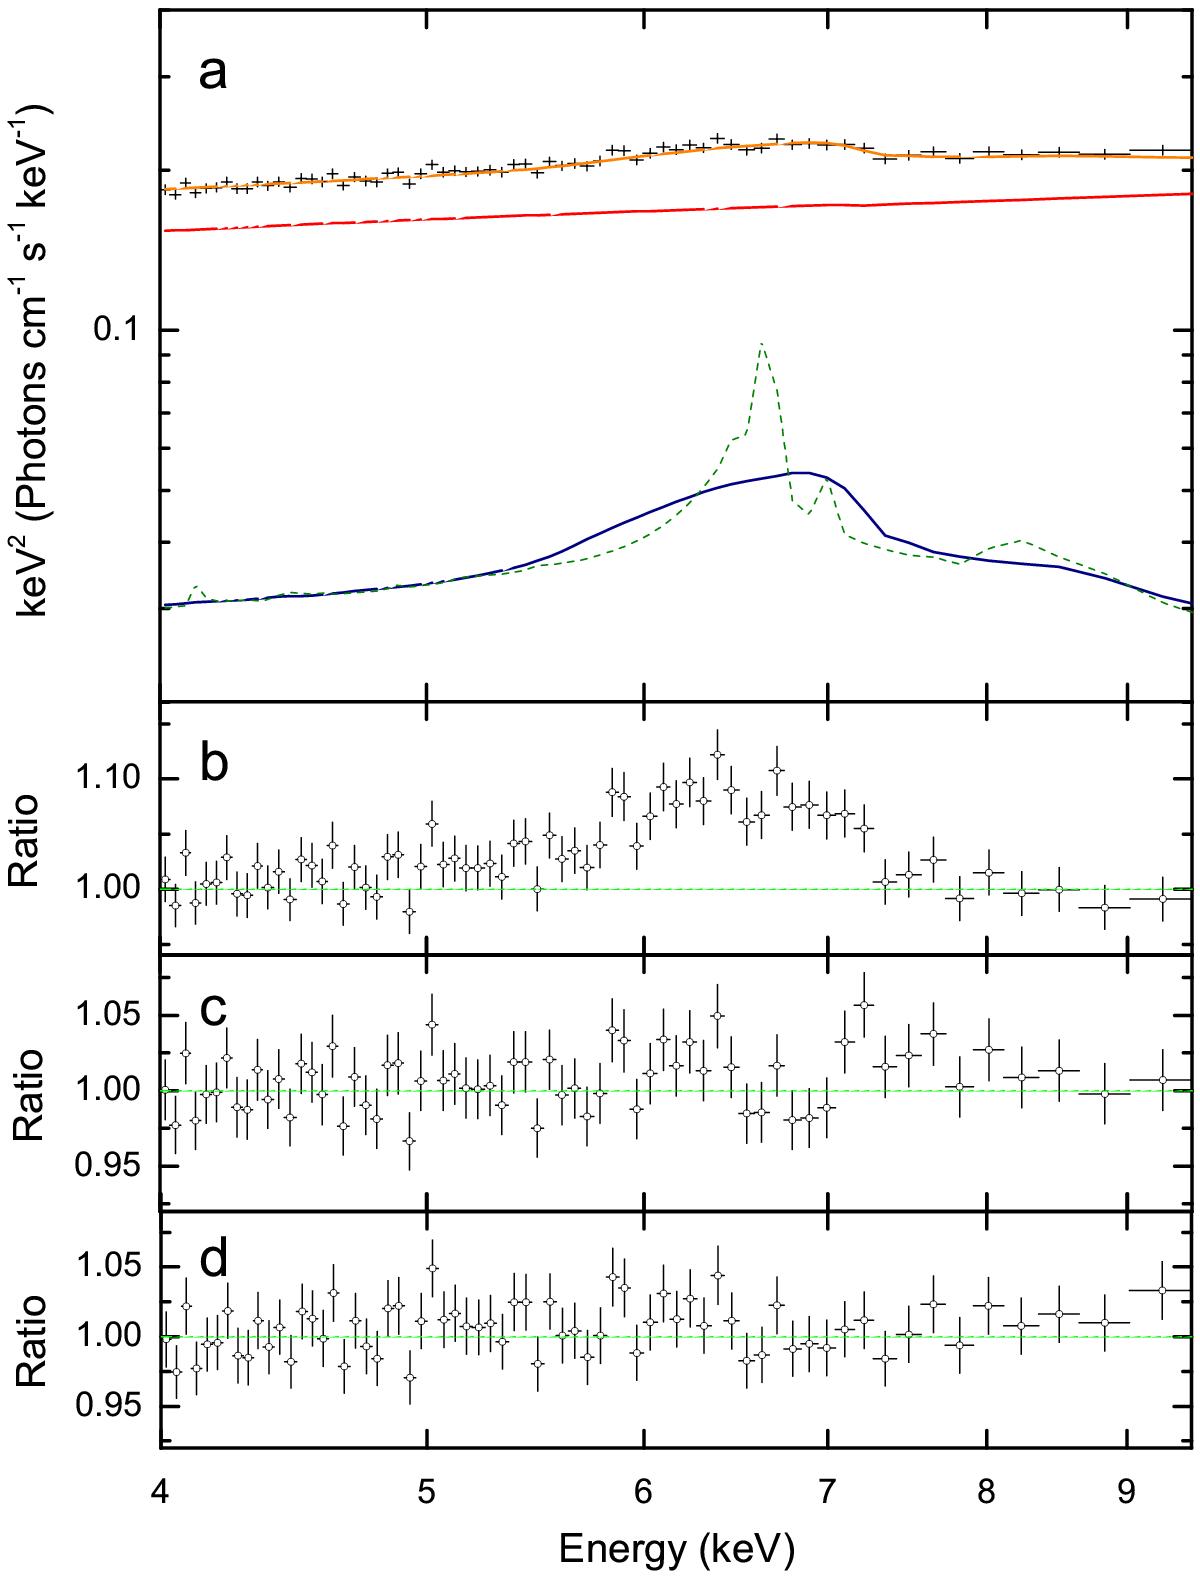
a) Unfolded spectral fit for the 2011 HIMS observation (Observation 2b) using relconv∗xillver to model the reflection component. The colour scheme follows that of Fig. 4. b) Data/model ratio for the continuum fit in Table 2 displaying strongly broadened Fe Kα emission. c) Model residuals when using relline to model the Fe line. d) Data/model ratio when the reflection is modelled using relconv∗xillver. The spectra have been re-binned for the purposes of plotting.
Current usage metrics show cumulative count of Article Views (full-text article views including HTML views, PDF and ePub downloads, according to the available data) and Abstracts Views on Vision4Press platform.
Data correspond to usage on the plateform after 2015. The current usage metrics is available 48-96 hours after online publication and is updated daily on week days.
Initial download of the metrics may take a while.