Free Access
Fig. 10
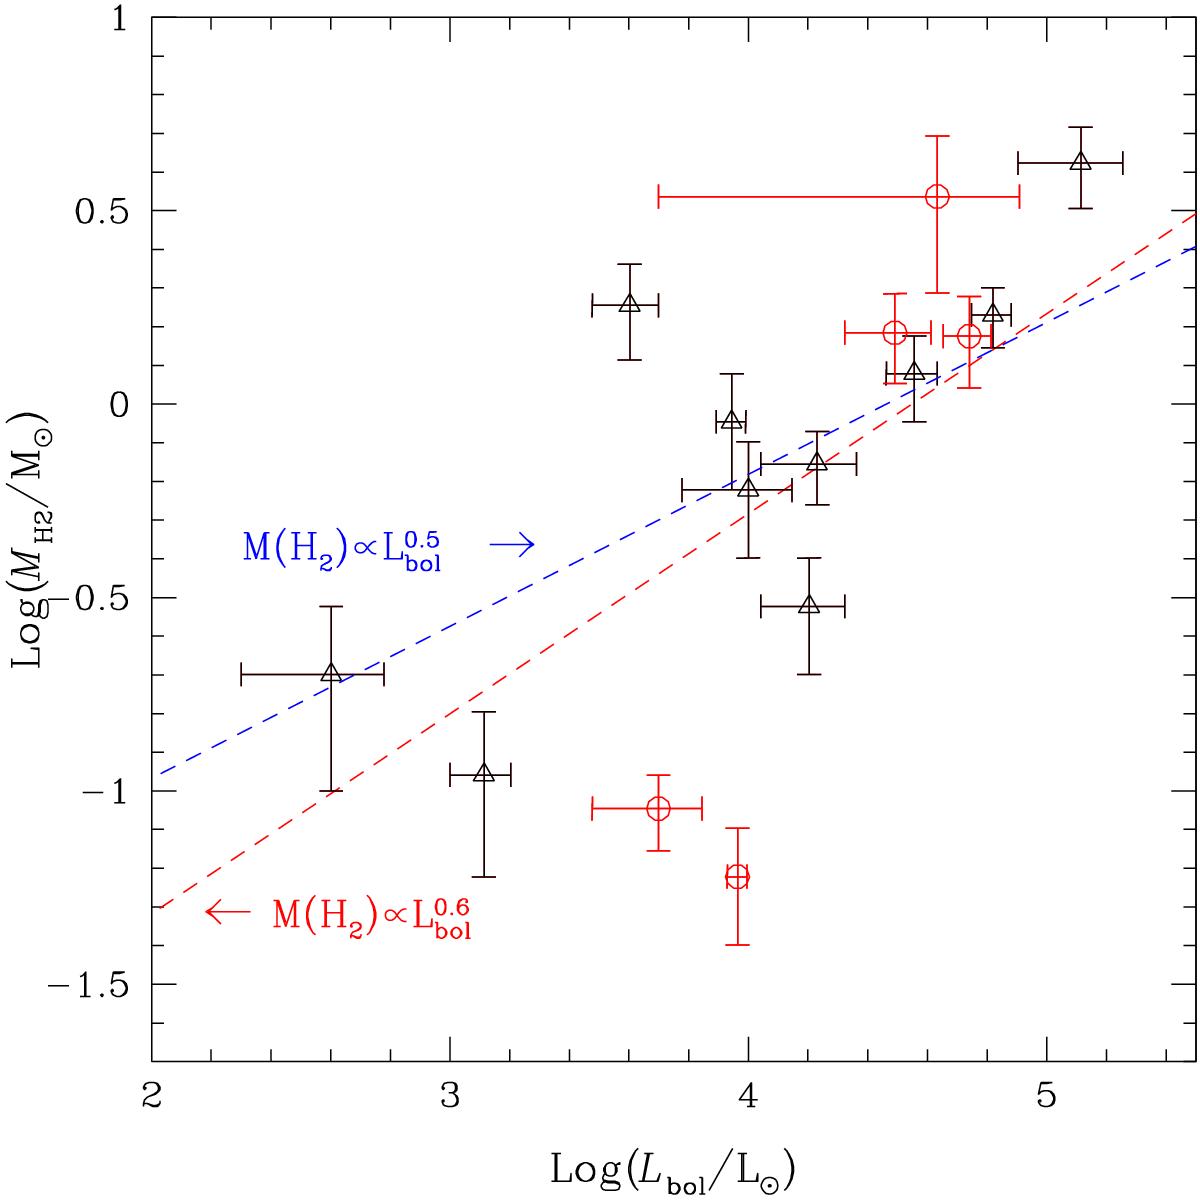
Log(M(H2)) vs. Log (Lbol) for the sources of the current survey plus IRAS 20126+4104. The red circles are the five outliers of Fig. 9. The red dashed line represents the best linear fit to the whole sample, whereas the blue dashed line represents the best linear fit to a smaller sample, which excludes the five outliers.
Current usage metrics show cumulative count of Article Views (full-text article views including HTML views, PDF and ePub downloads, according to the available data) and Abstracts Views on Vision4Press platform.
Data correspond to usage on the plateform after 2015. The current usage metrics is available 48-96 hours after online publication and is updated daily on week days.
Initial download of the metrics may take a while.