Free Access
Fig. 14
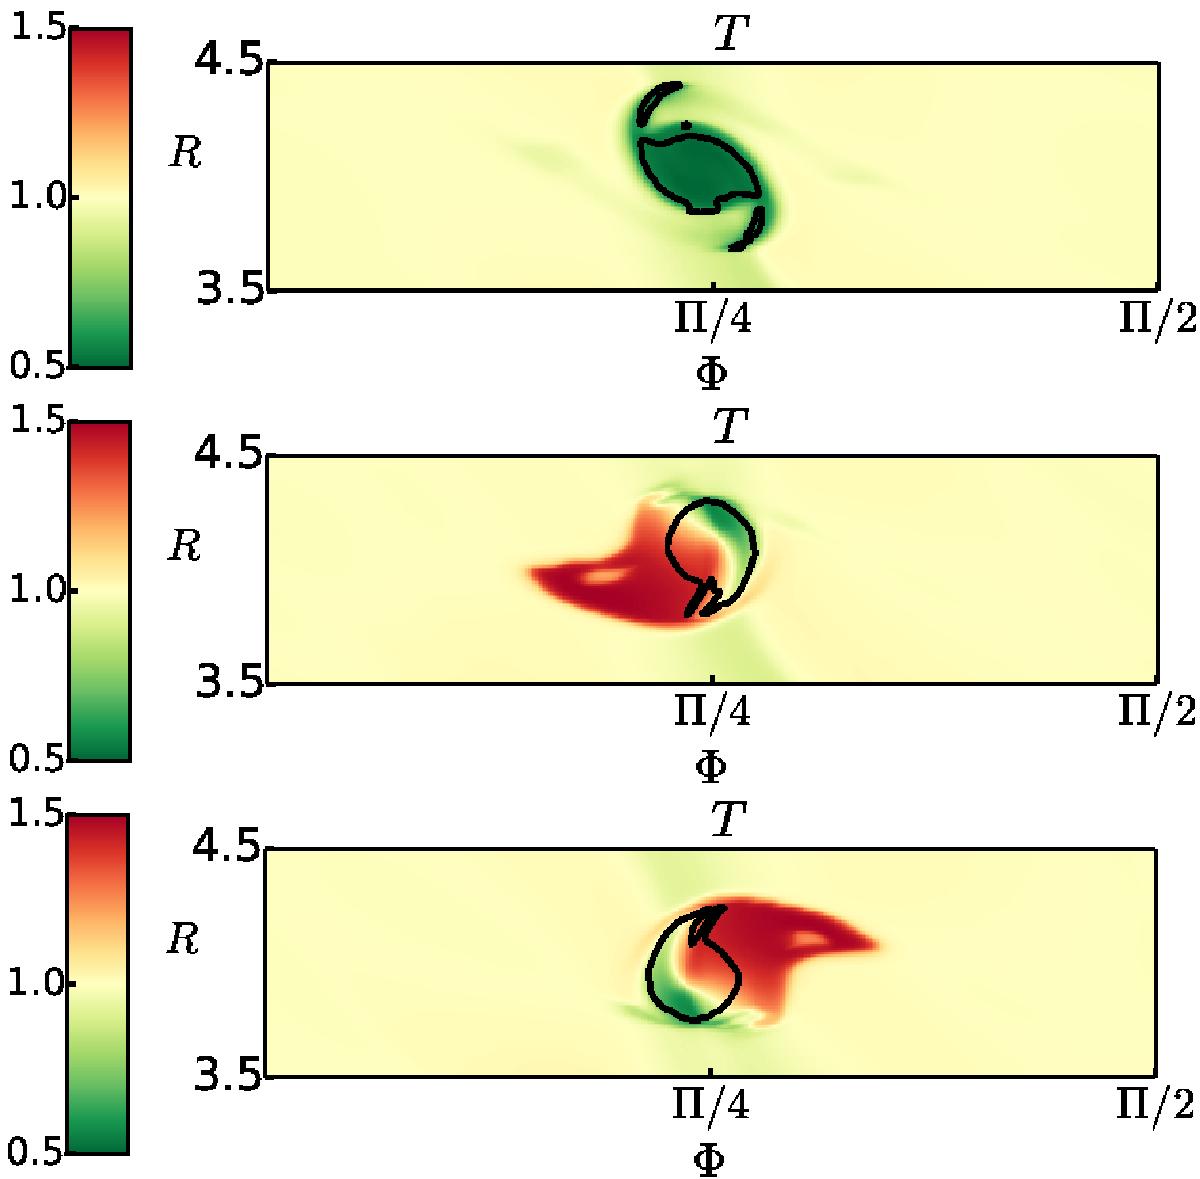
Snapshots of the temperature (normalized by the mean temperature) in the vortex in model PLPCOOL (top panel), PLPCOOL- (middle panel), and PLPCOOL+ (bottom panel). The black line shows an iso-vorticity contour where the vorticy is equal to the opposite of the vorticity of the background Keplerian shear profile.
This figure is made of several images, please see below:
Current usage metrics show cumulative count of Article Views (full-text article views including HTML views, PDF and ePub downloads, according to the available data) and Abstracts Views on Vision4Press platform.
Data correspond to usage on the plateform after 2015. The current usage metrics is available 48-96 hours after online publication and is updated daily on week days.
Initial download of the metrics may take a while.