Fig. 3
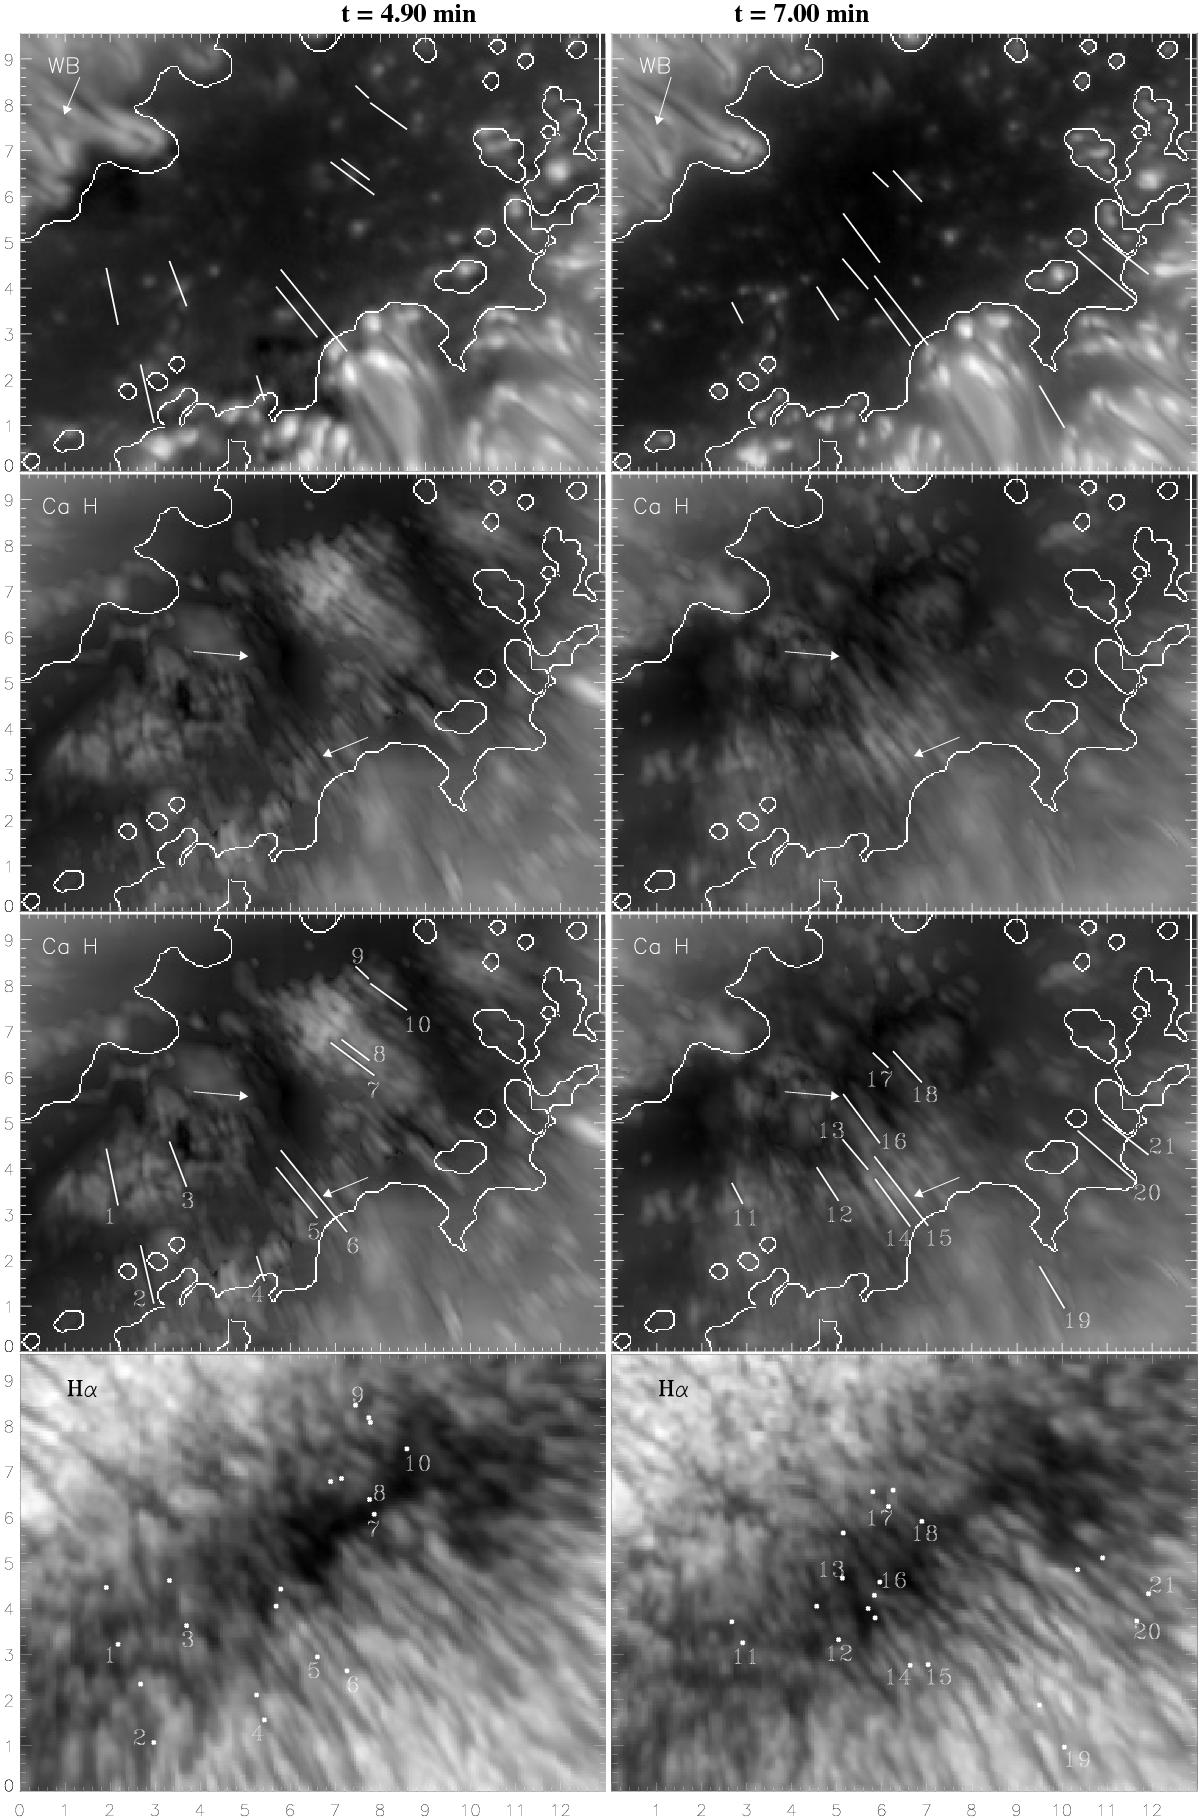
Two columns show two consecutive flashes, in different wavelengths, that occurred 2.10 min apart in Spot B. Top row: WB images. The top left arrow indicates the disk-centre direction. Second row: Ca II H core images composed using the technique from Sect. 2.1. The arrow on the right points to a pair of dark structures visible in both columns. The arrow on the left points to the base of a triangular-shaped structure. Third row: same as the second row, except with the traces used to measure lengths overplotted. The contours show the umbra outlined using intensity thresholds in the WB. Bottom row: corresponding frames observed in H-alpha with white markers showing the extremities of the traces overplotted in the third row. Major tickmarks every 1′′. The Ca ii H core frames, without composition, are shown in the online movie.
Current usage metrics show cumulative count of Article Views (full-text article views including HTML views, PDF and ePub downloads, according to the available data) and Abstracts Views on Vision4Press platform.
Data correspond to usage on the plateform after 2015. The current usage metrics is available 48-96 hours after online publication and is updated daily on week days.
Initial download of the metrics may take a while.