Fig. 11
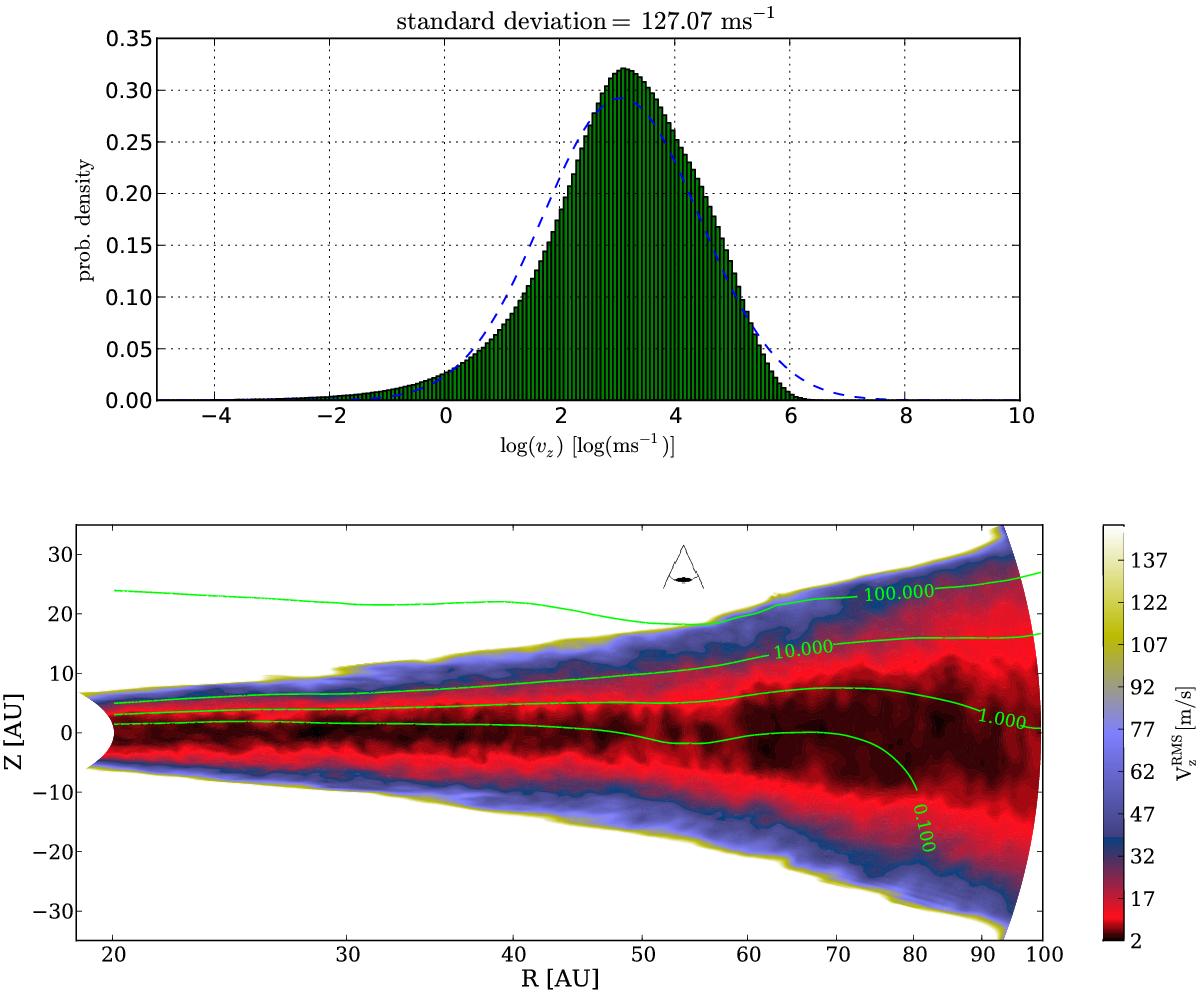
Top: histogram of the vertical velocity component in disk model D2G_e-4. The mean value of the distribution is at zero and the FWHM is ≈ 127 ms-1. The distribution is close to a log-normal distribution. Bottom: contour plot of the vertical RMS velocity component in disk model D2G_e-2. Dotted lines correspond to optical depth τz = 1 lines along the vertical direction for an opacity of κgas = 100,10,1,0.1,cm2/ g. The line of sight of an observer is indicated by an eye sketch.
Current usage metrics show cumulative count of Article Views (full-text article views including HTML views, PDF and ePub downloads, according to the available data) and Abstracts Views on Vision4Press platform.
Data correspond to usage on the plateform after 2015. The current usage metrics is available 48-96 hours after online publication and is updated daily on week days.
Initial download of the metrics may take a while.