Fig. 4
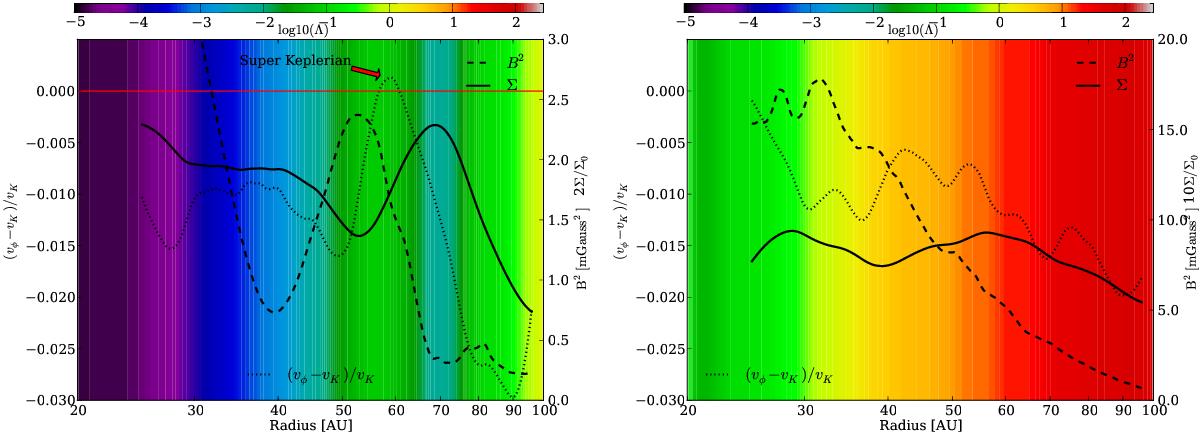
Radial profiles of space and time averaged surface density (solid line), magnetic pressure (dashed line) and deviation of Keplerian rotation (dotted line) for model D2G_e-2 (left) and model D2G_e-4 (right). The background contour color shows the space and time averaged value of the Elsasser number. The red solid line and annotation show the region of super Keplerian rotating gas. At this location, large particles are getting trapped.
Current usage metrics show cumulative count of Article Views (full-text article views including HTML views, PDF and ePub downloads, according to the available data) and Abstracts Views on Vision4Press platform.
Data correspond to usage on the plateform after 2015. The current usage metrics is available 48-96 hours after online publication and is updated daily on week days.
Initial download of the metrics may take a while.