Free Access
Fig. 7
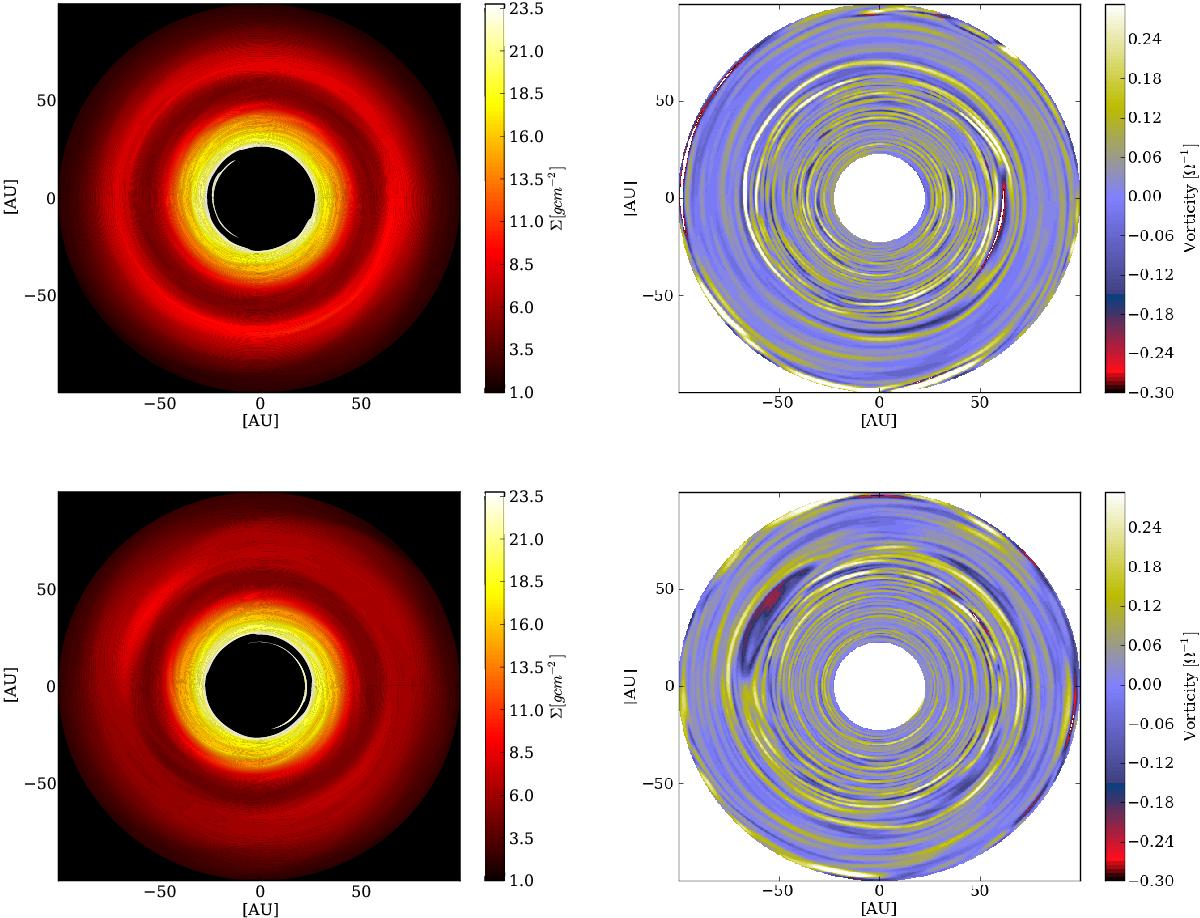
Surface density maps (left) for two different time outputs (800 and 1045 inner orbits) for model D2G_e-2 with the corresponding vorticity maps (right).
Current usage metrics show cumulative count of Article Views (full-text article views including HTML views, PDF and ePub downloads, according to the available data) and Abstracts Views on Vision4Press platform.
Data correspond to usage on the plateform after 2015. The current usage metrics is available 48-96 hours after online publication and is updated daily on week days.
Initial download of the metrics may take a while.