Free Access
Fig. 4
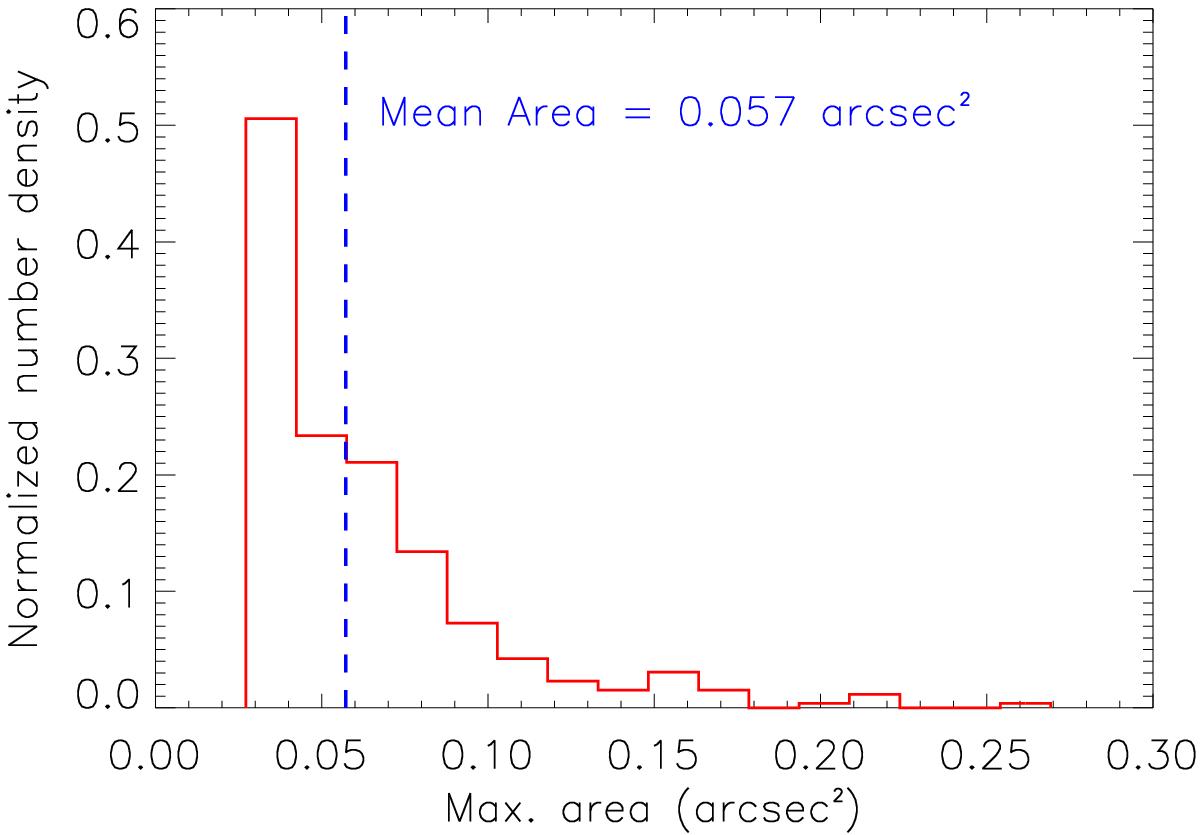
Histogram of maximum area reached by each jet for all studied positions on the solar disk. The area density has been normalized to 1 by dividing by the total number of jets. Only jets with areas larger than 0.027 arcsec2 are displayed.
Current usage metrics show cumulative count of Article Views (full-text article views including HTML views, PDF and ePub downloads, according to the available data) and Abstracts Views on Vision4Press platform.
Data correspond to usage on the plateform after 2015. The current usage metrics is available 48-96 hours after online publication and is updated daily on week days.
Initial download of the metrics may take a while.