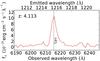
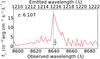
Fig. 9
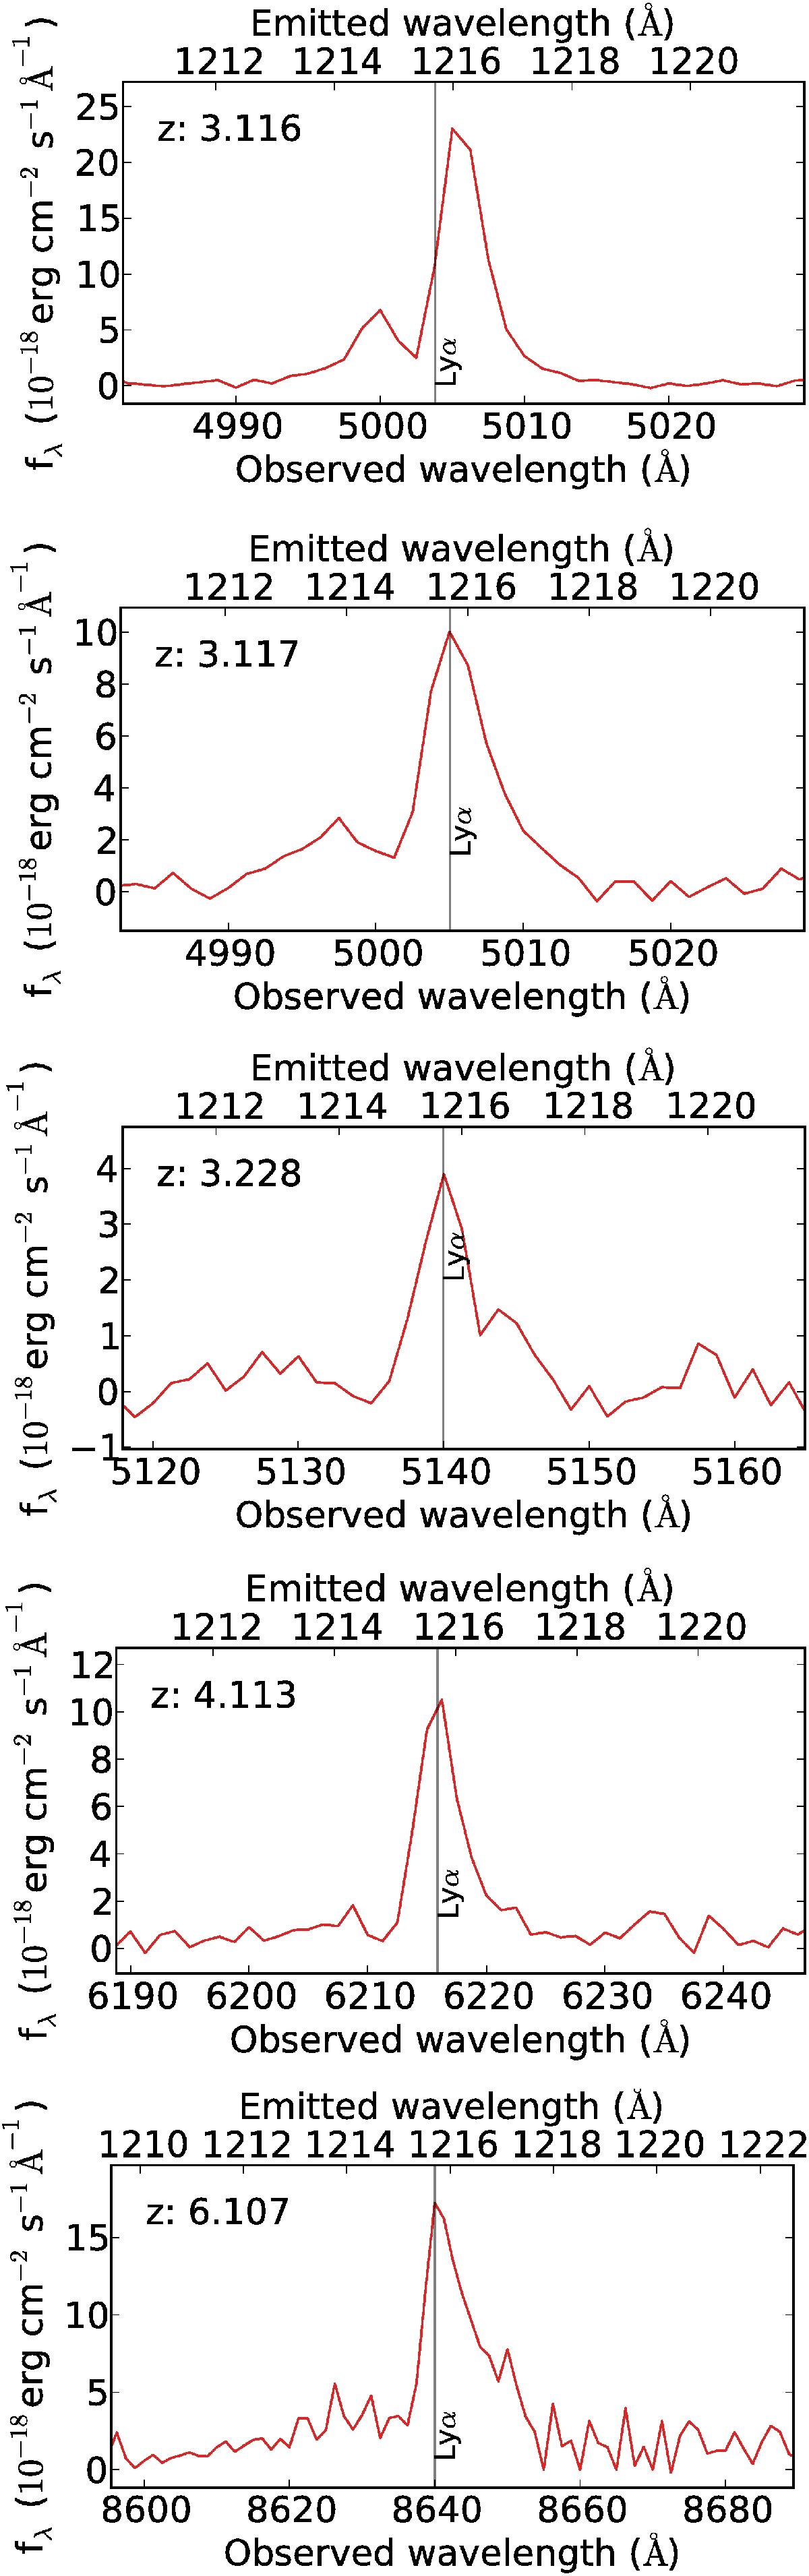
Full-resolution MUSE 1D spectrum of sources (top to bottom) 49, 50, 51, 52, and 53, with wavelength on the horizontal axis and the flux on the vertical axis. The spectra are zoomed in on the Lyαline, which is indicated by the vertical black line. For source 49, we determined the redshift based on other UV-emission lines, while for the other sources we used Lyαto determine z. For sources 49, 52, and 53 the different images of the same source are stacked to optimise the signal-to-noise ratio. The fluctuations and non-zero continuum around Lyαin object 53 are the result of locally increased noise.
Current usage metrics show cumulative count of Article Views (full-text article views including HTML views, PDF and ePub downloads, according to the available data) and Abstracts Views on Vision4Press platform.
Data correspond to usage on the plateform after 2015. The current usage metrics is available 48-96 hours after online publication and is updated daily on week days.
Initial download of the metrics may take a while.