Fig. 11
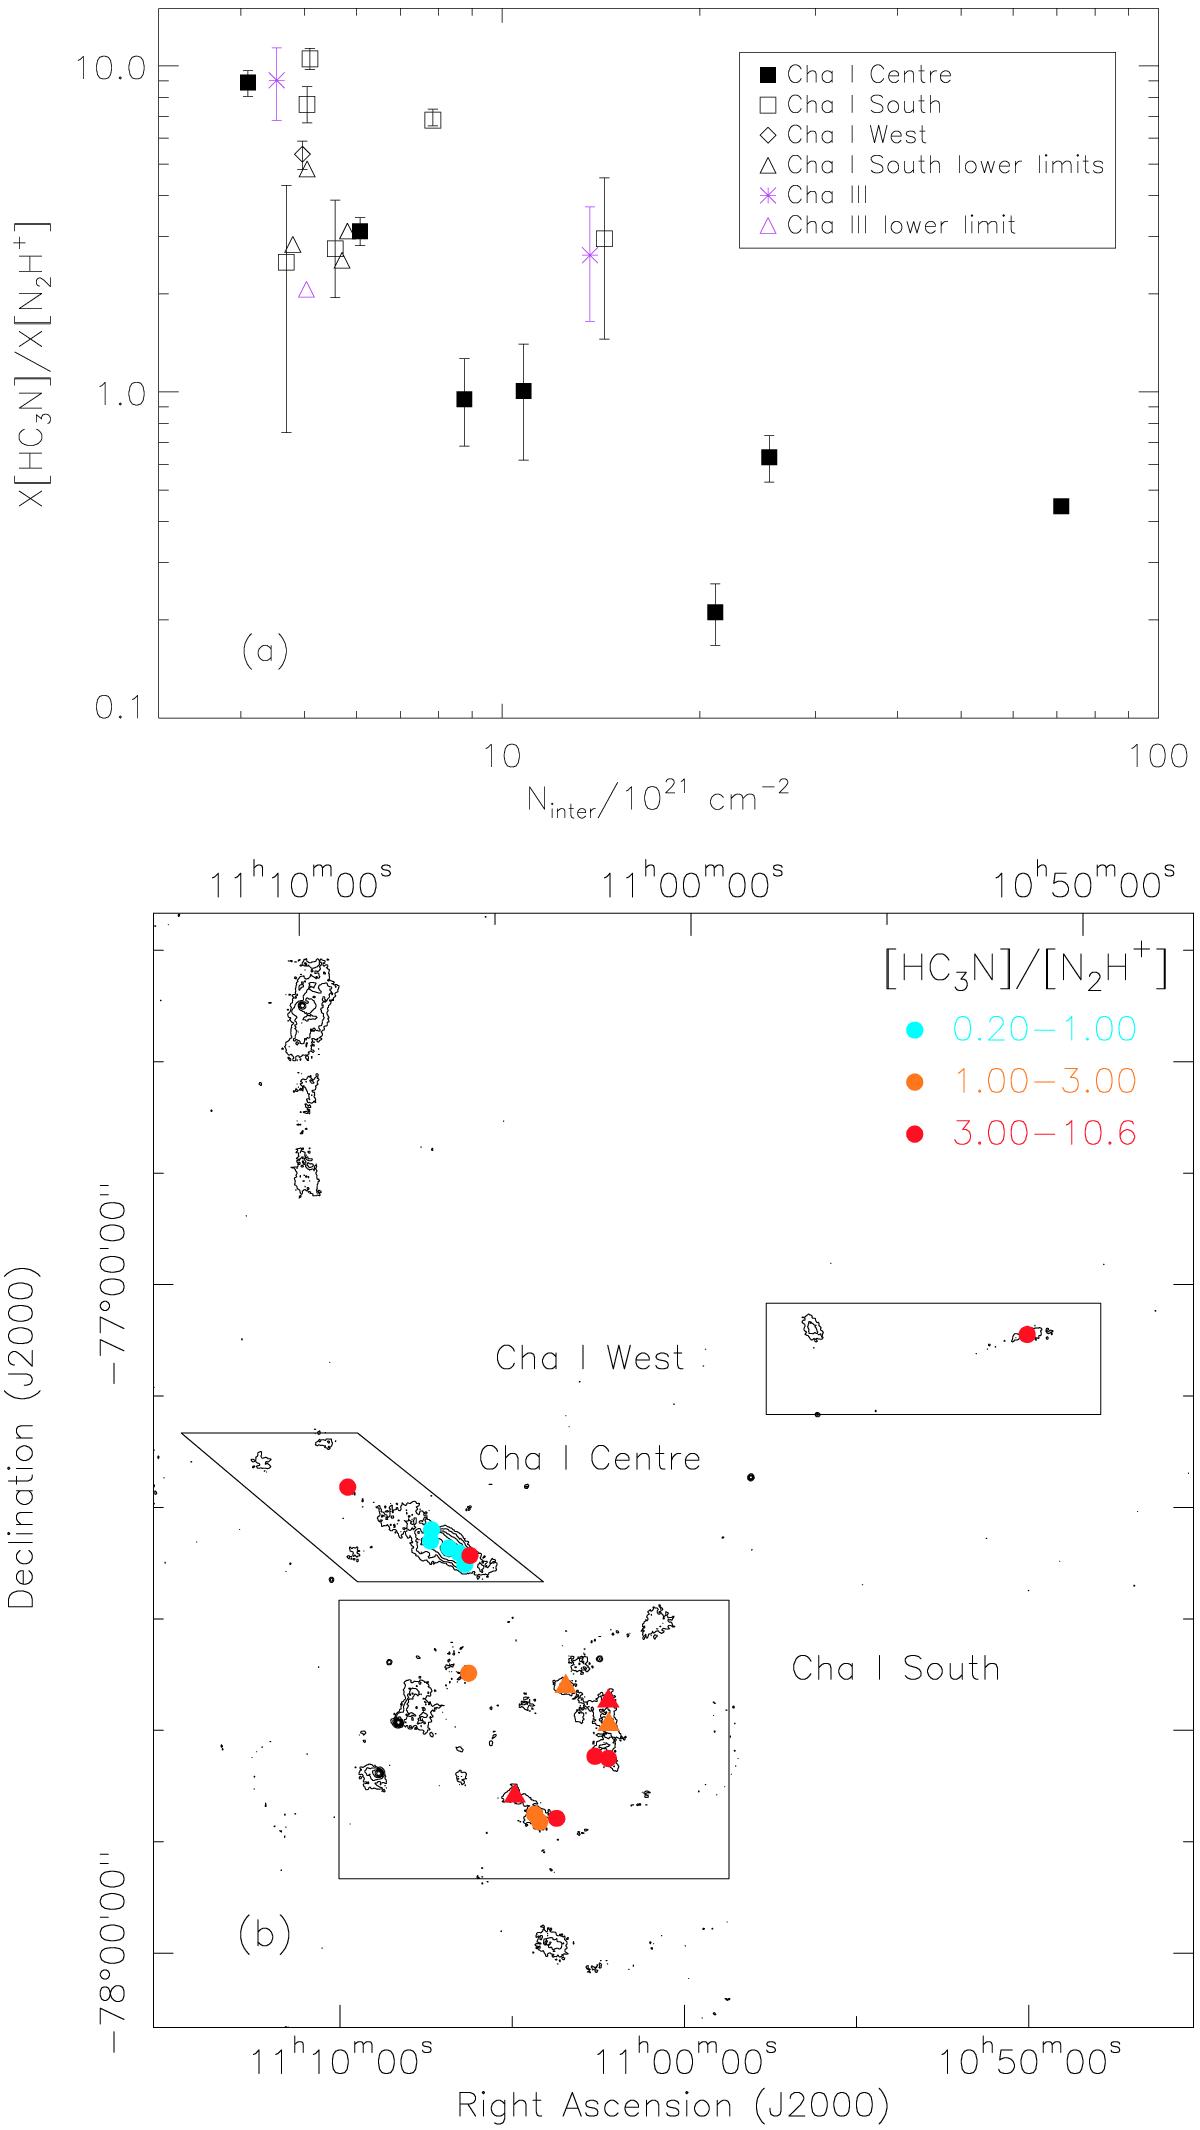
a) Observed HC3N/N2H+ abundance ratio as a function of H2 column density for the cores in Cha I Centre (black, filled squares), Cha I South (black, empty squares), Cha I West (black diamond), Cha I South lower limits (black, empty triangles), Cha III (pink asterisks), and Cha III lower limits (pink, empty triangle). b) Observed HC3N/N2H+ abundance ratios for Cha I (circles) and lower limits (triangles) overplotted on the 870 μm dust continuum emission obtained with LABOCA (Belloche et al. 2011a). The contour levels correspond to a, 2a, 4a, 8a, 16a, 32a, with a = 48 mJy/21′′-beam (4σ).
Current usage metrics show cumulative count of Article Views (full-text article views including HTML views, PDF and ePub downloads, according to the available data) and Abstracts Views on Vision4Press platform.
Data correspond to usage on the plateform after 2015. The current usage metrics is available 48-96 hours after online publication and is updated daily on week days.
Initial download of the metrics may take a while.