Free Access
Fig. 13
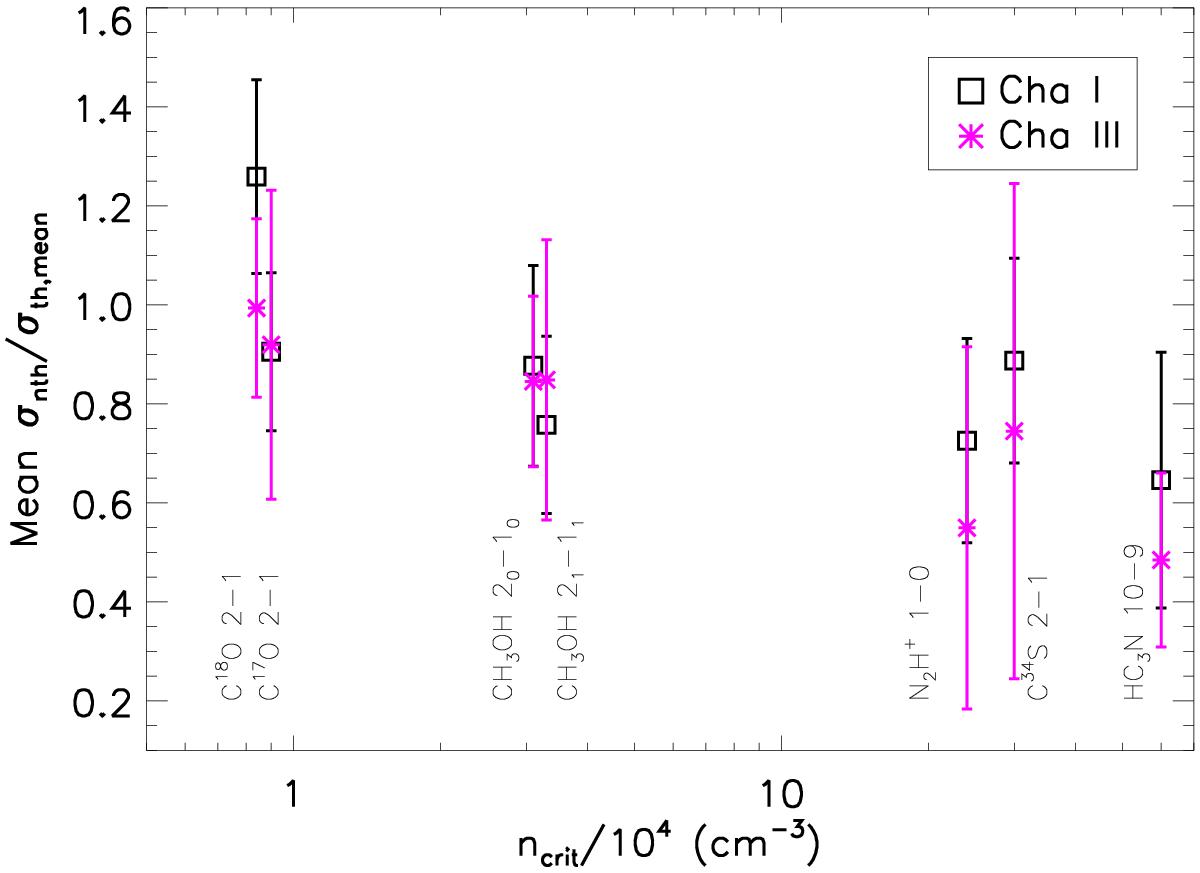
Mean ratio of non-thermal to thermal (of the mean particle) velocity dispersions against the critical density for the transitions listed in Table 11 for the Cha I (black squares) and III (pink asterisks) clouds. The errorbars show the dispersions from the mean.
Current usage metrics show cumulative count of Article Views (full-text article views including HTML views, PDF and ePub downloads, according to the available data) and Abstracts Views on Vision4Press platform.
Data correspond to usage on the plateform after 2015. The current usage metrics is available 48-96 hours after online publication and is updated daily on week days.
Initial download of the metrics may take a while.