Fig. 2
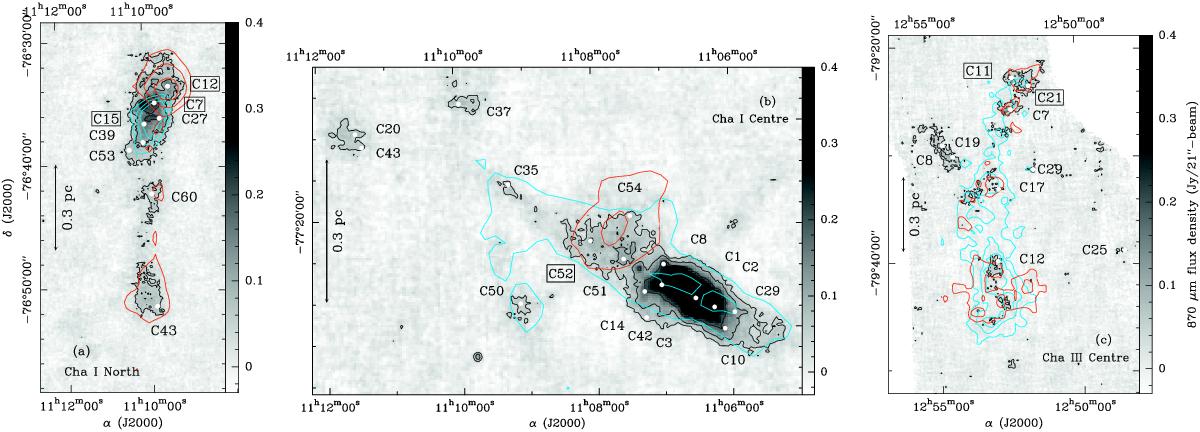
C18O 1–0 blueshifted and redshifted emissions in a) Cha I North, b) Cha I Centre, and c) Cha III Centre overlaid on the 870 μm dust continuum maps of Cha I and III (Belloche et al. 2011a,b). The C18O 1−0 data are from Haikala et al. (2005) for Cha I and Gahm et al. (2002) for Cha III. The continuum contour levels (black) correspond to a, 2a, 4a, 8a, 16a, 32a, with a = 48 mJy/21″-beam (4σ) for a) and b), while a = 34.5 mJy/21″-beam (3σ) for c). The blueshifted (subscript b) and redshifted (subscript r) C18O 1−0 contours correspond to the levels a) 3σb (3σr), 4σb (4σr), 5σb (5σr) with σb = 0.17 K km s-1 and σr = 0.3 K km s-1, b) 3σb (3σr), 4.5σb (5σr) with σb = 0.33 K km s-1 and σr = 0.22 K km s-1, and c) 4σb (4σr), 6σb (6σr), 8σb with σb = 0.08 K km s-1 and σr = 0.09 K km s-1. The velocity ranges for the blueshifted and redshifted integrated intensity emissions are vb = 3.5 − 4.3 km s-1 and vr = 4.3−5.5 km s-1 for a), vb = 3.8 − 4.8 km s-1 and vr = 4.8−6.0 km s-1 for b), and vb = 0.5 − 1.5 km s-1 and vr = 1.5−2.5 km s-1 for c). The white dots show the location of the continuum cores in each region. The sources with spectra displayed in Fig. 1 are highlighted with a box around their name.
Current usage metrics show cumulative count of Article Views (full-text article views including HTML views, PDF and ePub downloads, according to the available data) and Abstracts Views on Vision4Press platform.
Data correspond to usage on the plateform after 2015. The current usage metrics is available 48-96 hours after online publication and is updated daily on week days.
Initial download of the metrics may take a while.