Fig. 7
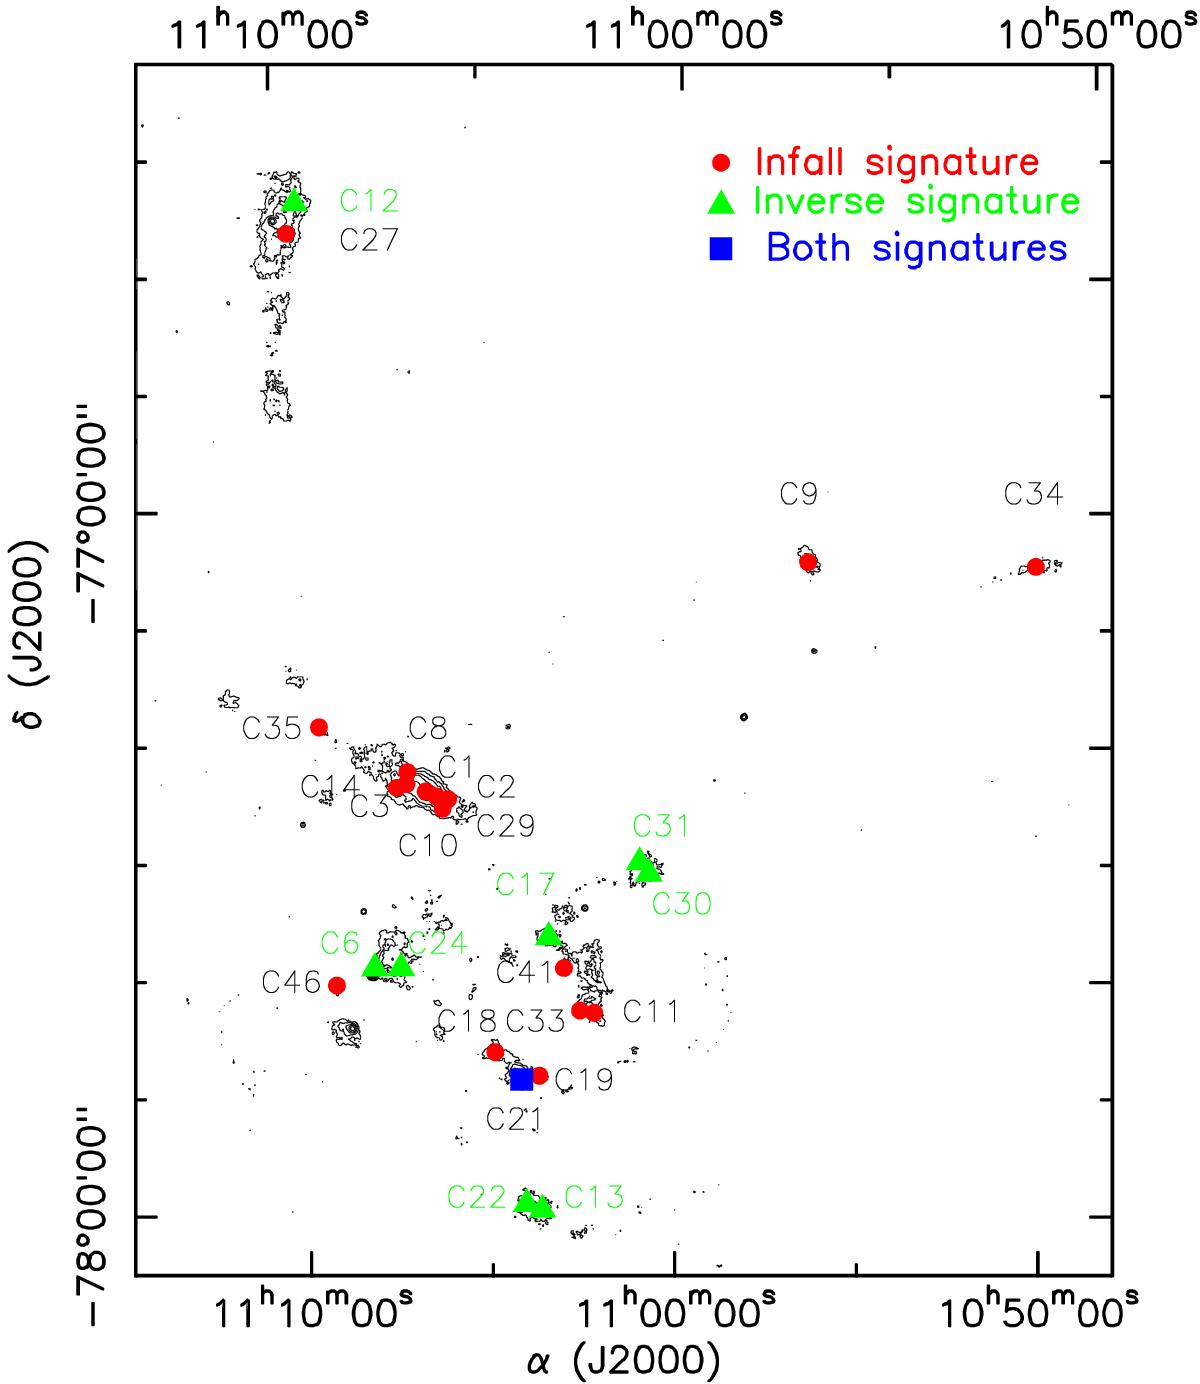
Cores showing the “infall” signature in Cha I (corresponding to Fig. 4) are plotted as red filled circles, the cores showing the opposite signature as green triangles, and the cores showing both signatures as blue squares. The contours correspond to the 870 μm dust continuum emission obtained with LABOCA (Belloche et al. 2011a) with contour levels of a, 2a, 4a, 8a, 16a, 32a, and a = 48 mJy/21′′-beam (4σ).
Current usage metrics show cumulative count of Article Views (full-text article views including HTML views, PDF and ePub downloads, according to the available data) and Abstracts Views on Vision4Press platform.
Data correspond to usage on the plateform after 2015. The current usage metrics is available 48-96 hours after online publication and is updated daily on week days.
Initial download of the metrics may take a while.